تحليل بيانات موظفين
تفاصيل العمل
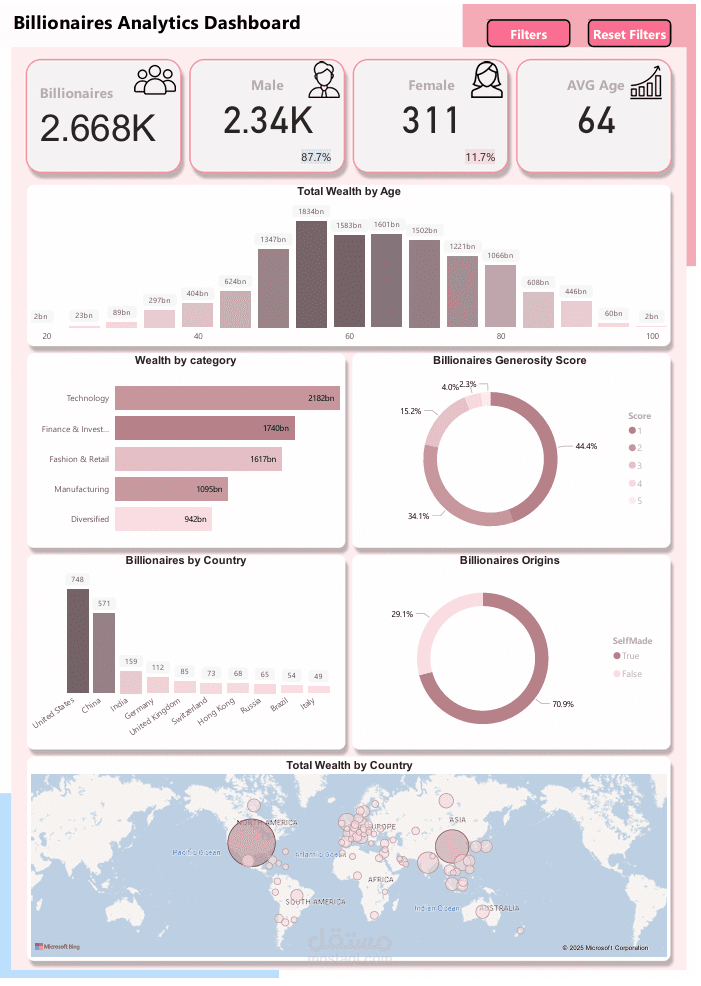
Power BI project "the Billionaires Analytics Dashboard", a deep-dive analytical tool that reveals the story behind the world’s 2,668 billionaires in 2022.
The Billionaires Analytics Dashboard is an interactive business intelligence tool designed to explore and analyze the wealth, demographics, and backgrounds of the world's richest individuals.
It delivers rich insights into global billionaire trends through engaging visualizations, allowing users to explore patterns in wealth distribution, industry dominance, and global presence.
Key Features
• Gender Breakdown: 87.7% male vs 11.7% female
• Average Age: 64 years
• Wealth by Age Group: Distribution across different age brackets
• Wealth by Industry: Technology, Finance, Retail, Manufacturing & more
• Country Insights:
– Number of billionaires per country
– Total wealth by country
• Self-Made Status: 70.9% are self-made
• Generosity Score: 5-point charitable ranking system
Design & UX Highlights
• Created a dedicated slicer page for better design and space optimization
• Interactive filters by category, country, and state
• Clean layout using card visuals, bar & column charts with a refined color scheme
️ Technical Skills Applied
• Power BI DAX Calculations
• Data Modeling & Schema Design
• Advanced Slicer Control & Page Navigation
• UX/UI Best Practices in Dashboard Design
• Analytical Storytelling through Data
This project was a valuable experience in turning complex datasets into meaningful, user-friendly insights. Feedback is always welcome—let me know your thoughts!