Dashboard for Car Sales
تفاصيل العمل
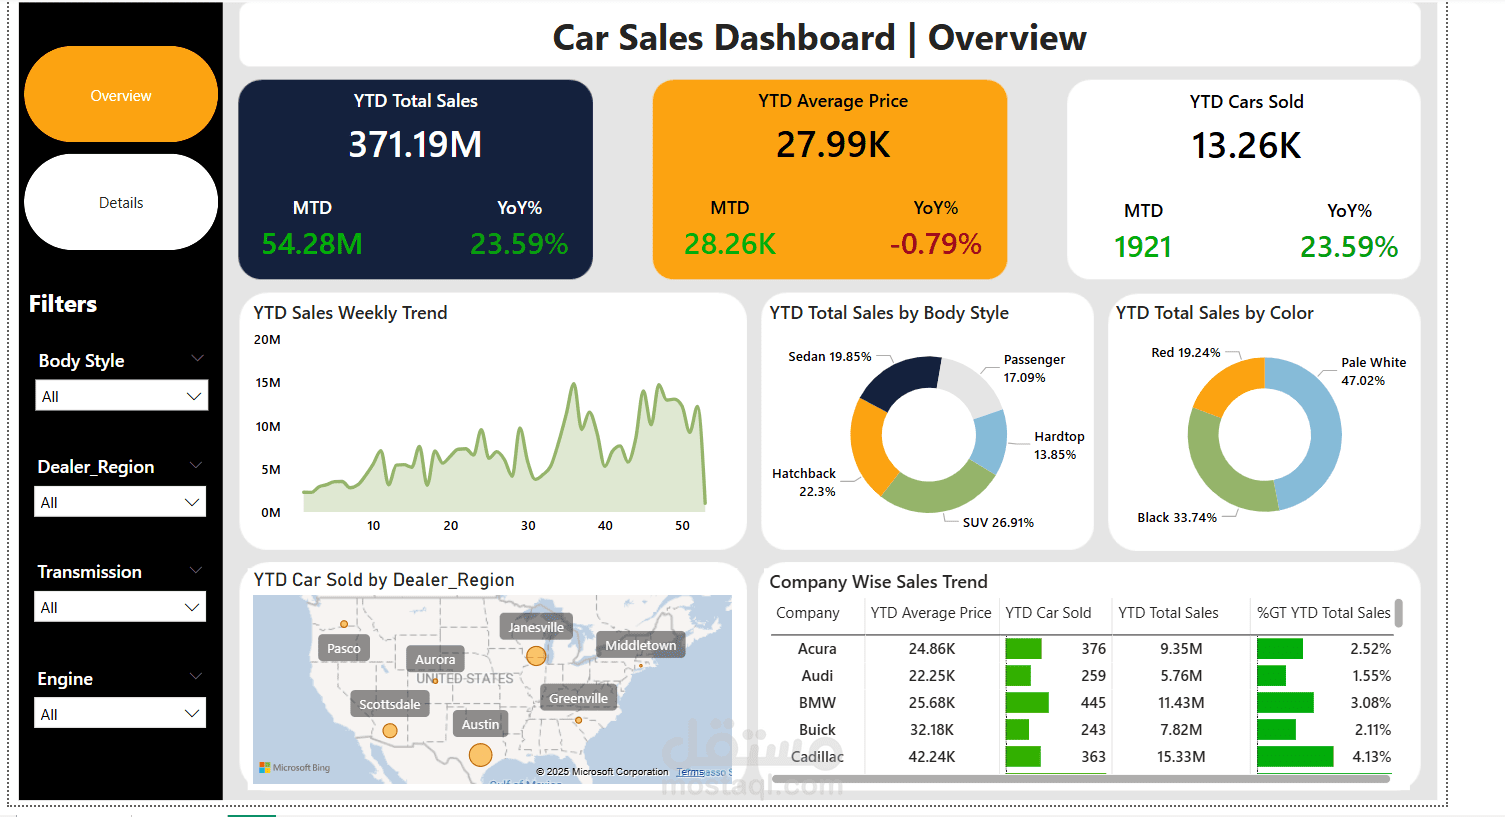
Car Sales Dashboard
I created this interactive Power BI dashboard to analyze car sales performance. It provides insights into total sales, average price, and cars sold with comparisons to the previous year.
Overview Page:
1-Displays key metrics like YTD (Year-to-Date) total sales, MTD (Month-to- Date) sales, and YoY (Year-over-Year) growth
2-Visualizes sales trends by week, body style, color, and dealer region
Shows company-wise sales trends for better decision-making
Details Page:
1-Contains a detailed table with Car ID, Date, Customer Name, Dealer, Brand, Color, Model, and Total Sales
2-Helps in deep data exploration to track which models and colors are performing best
Tools Used:
Power BI for visualization
Power Query for data cleaning
DAX for calculations