Dashboard for Blinkit Store
تفاصيل العمل
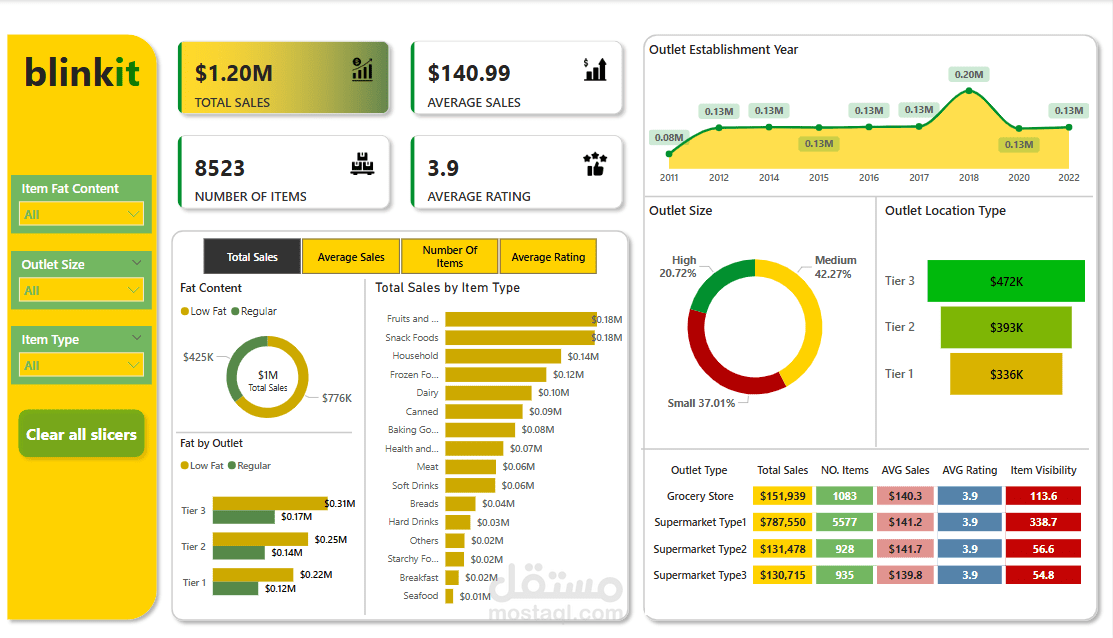
Unveiling Blinkit’s Sales Insights with Power BI!
I recently worked on a sales analytics dashboard to uncover key trends in retail sales. Here’s what I found:
Total Sales: $1.2M
Top-Selling Categories: Fruits, Snacks & Household Items ?
Outlet Performance: Tier 3 outlets lead with $472K in sales
Supermarkets Dominate: Highest sales at $787K
Sales Trends: Peaked in 2018 ($0.20M), fluctuating afterward
Key Takeaways:
1️⃣ Outlet size & location matter! Medium-sized outlets perform best.
2️⃣ Product Type Drives Sales! Focus on high-demand categories.
3️⃣ Historical Trends Guide Strategy! Businesses must adapt to changing trends.
️ Tools Used: Excel | Power BI | Data Visualization