Interactive Power BI dashboard
تفاصيل العمل
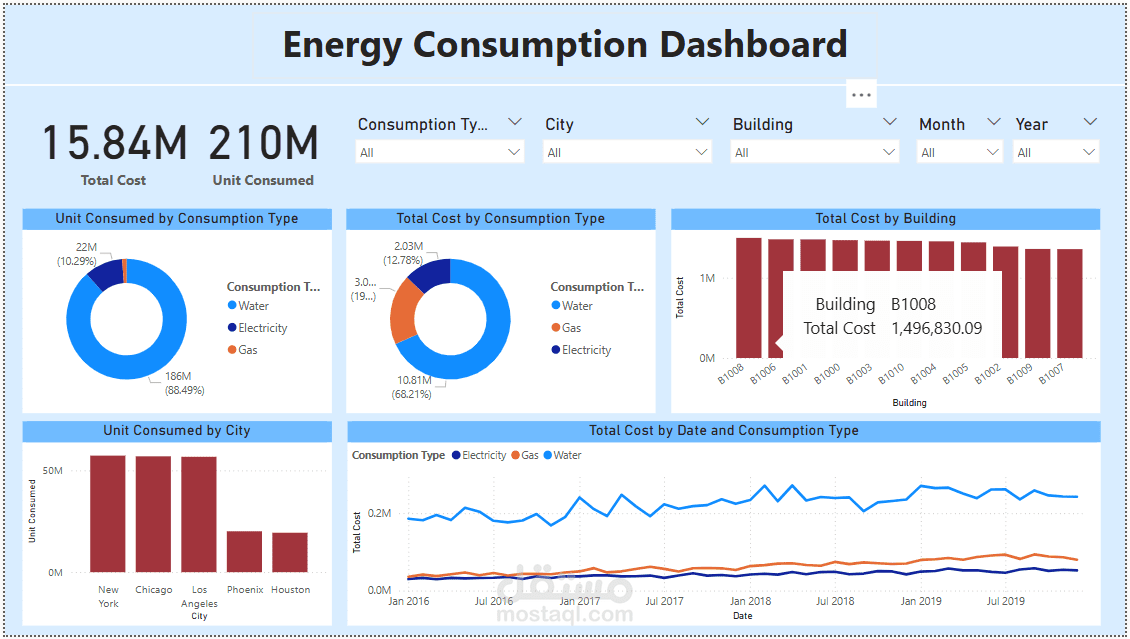
It is an interactive Power BI dashboard designed to visualize and analyze energy consumption data. The dashboard provides key insights into energy usage patterns, facilitating data-driven decision-making.
The Power BI dashboard offers the following features:
Total Energy Consumption: Displays the overall energy usage over a specified period.
Consumption Trends: Line charts illustrating energy consumption trends over time.
Regional Breakdown: Pie and bar charts showing energy usage across different regions or sectors.
Key Performance Indicators (KPIs): Highlights critical metrics such as peak consumption hours and average daily usage.