Mastering Power BI charts
تفاصيل العمل
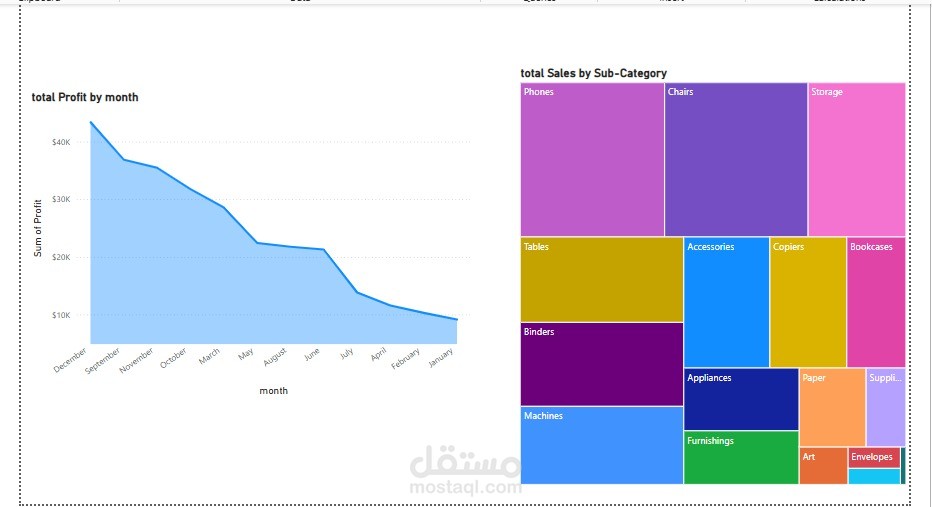
Here is a sample dataset attached with this assignment. Please connect it with Power BI repot to come up with different types of charts. Please stick firmly to the tricks & tips
Here is a sample dataset attached with this assignment. Please connect it with Power BI repot to come up with different types of charts. Please stick firmly to the tricks & tips