Superstore Business Performance Analysis Project
تفاصيل العمل
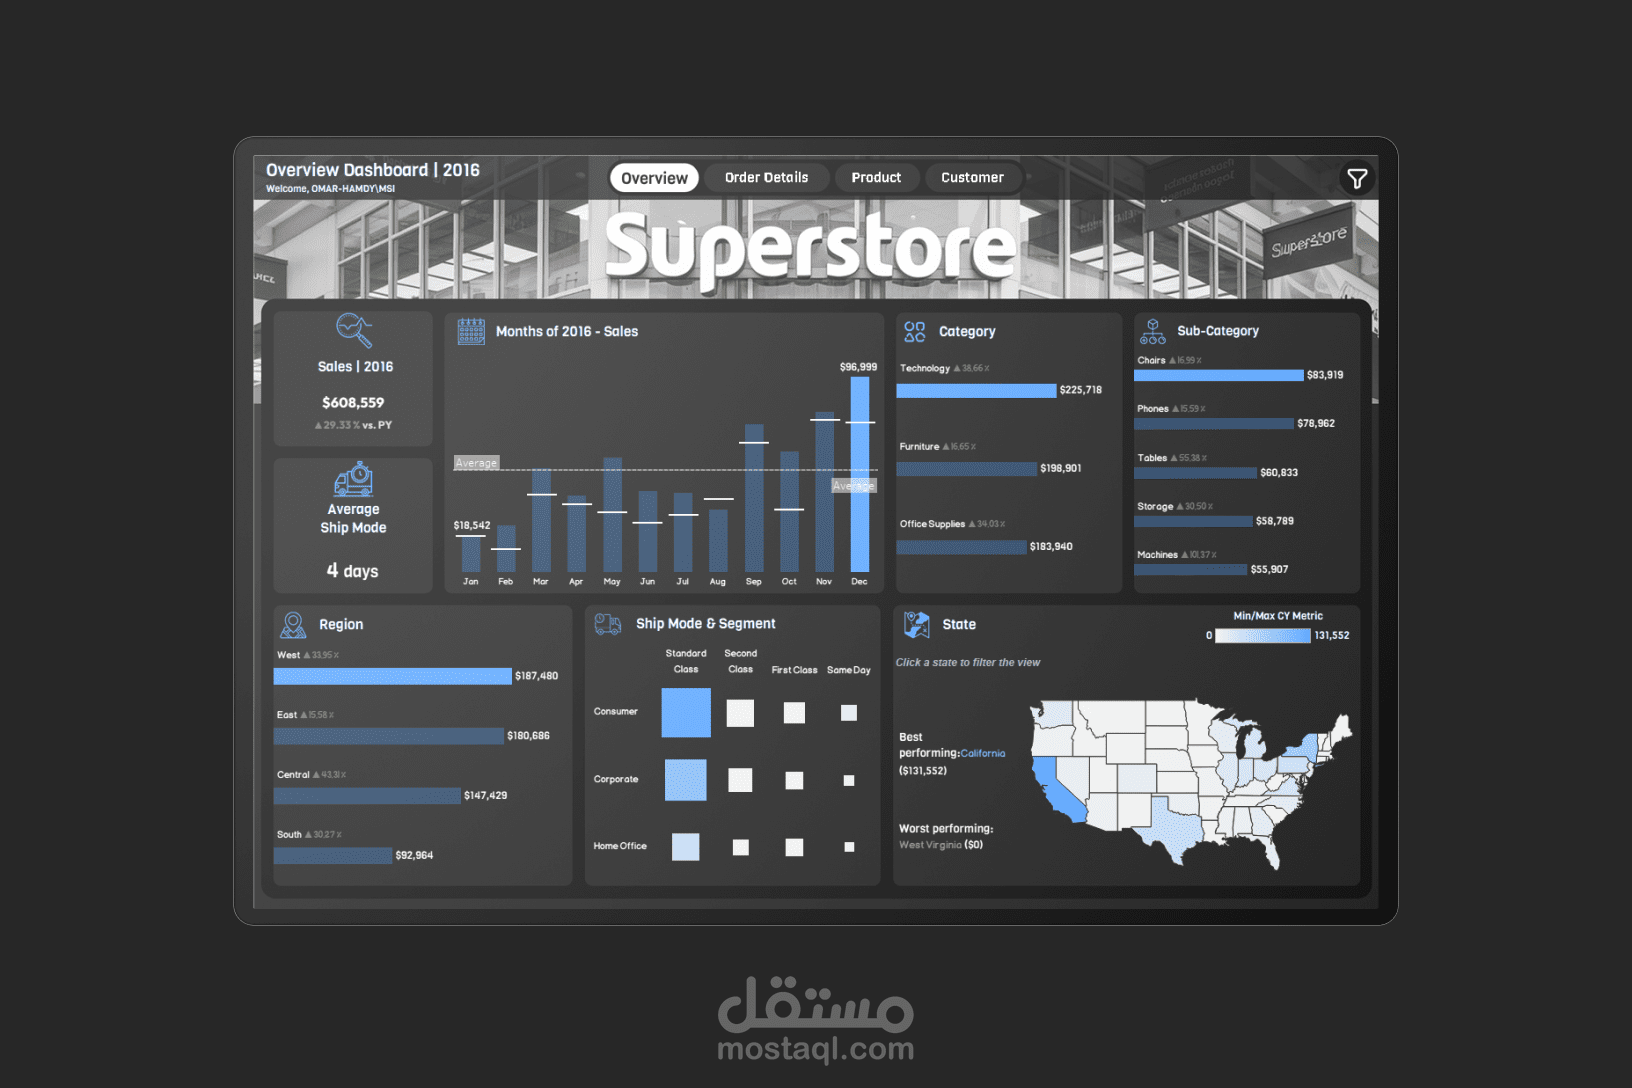
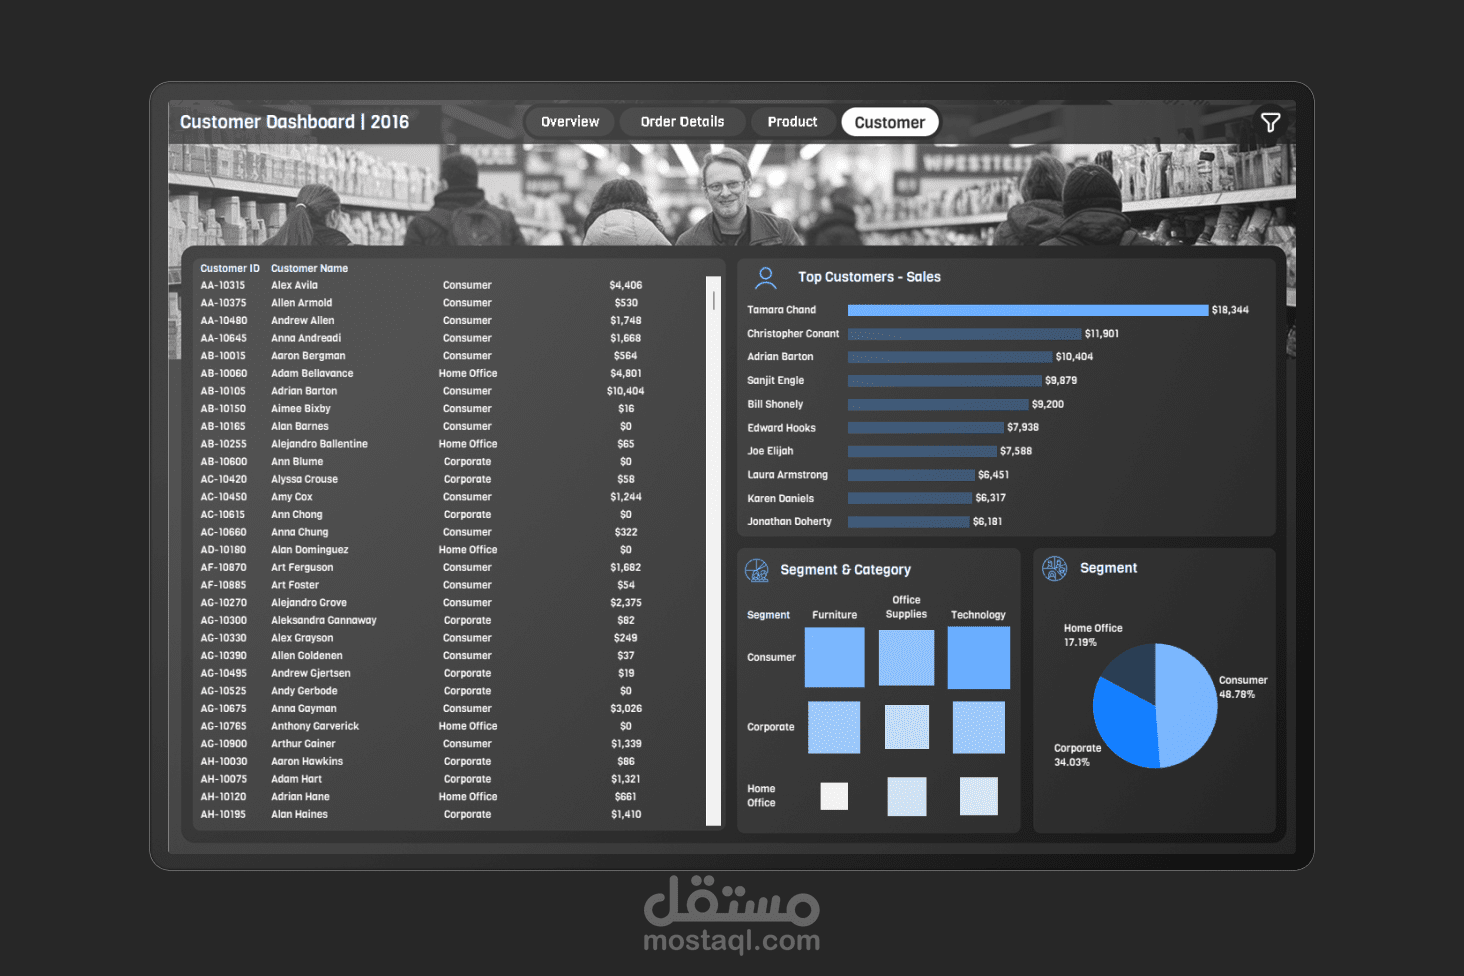
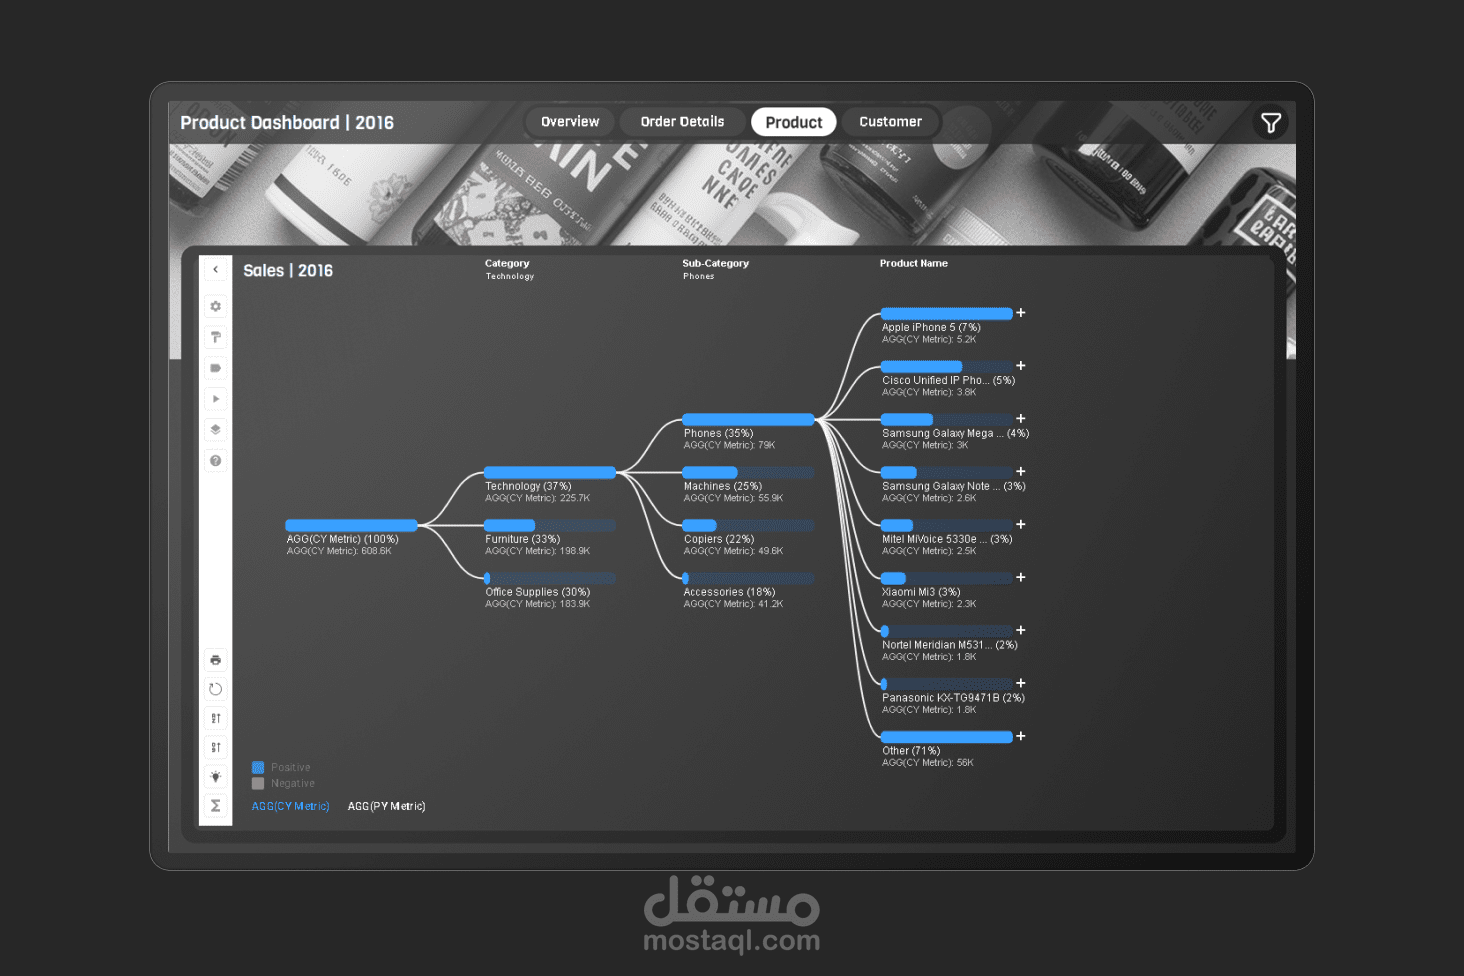
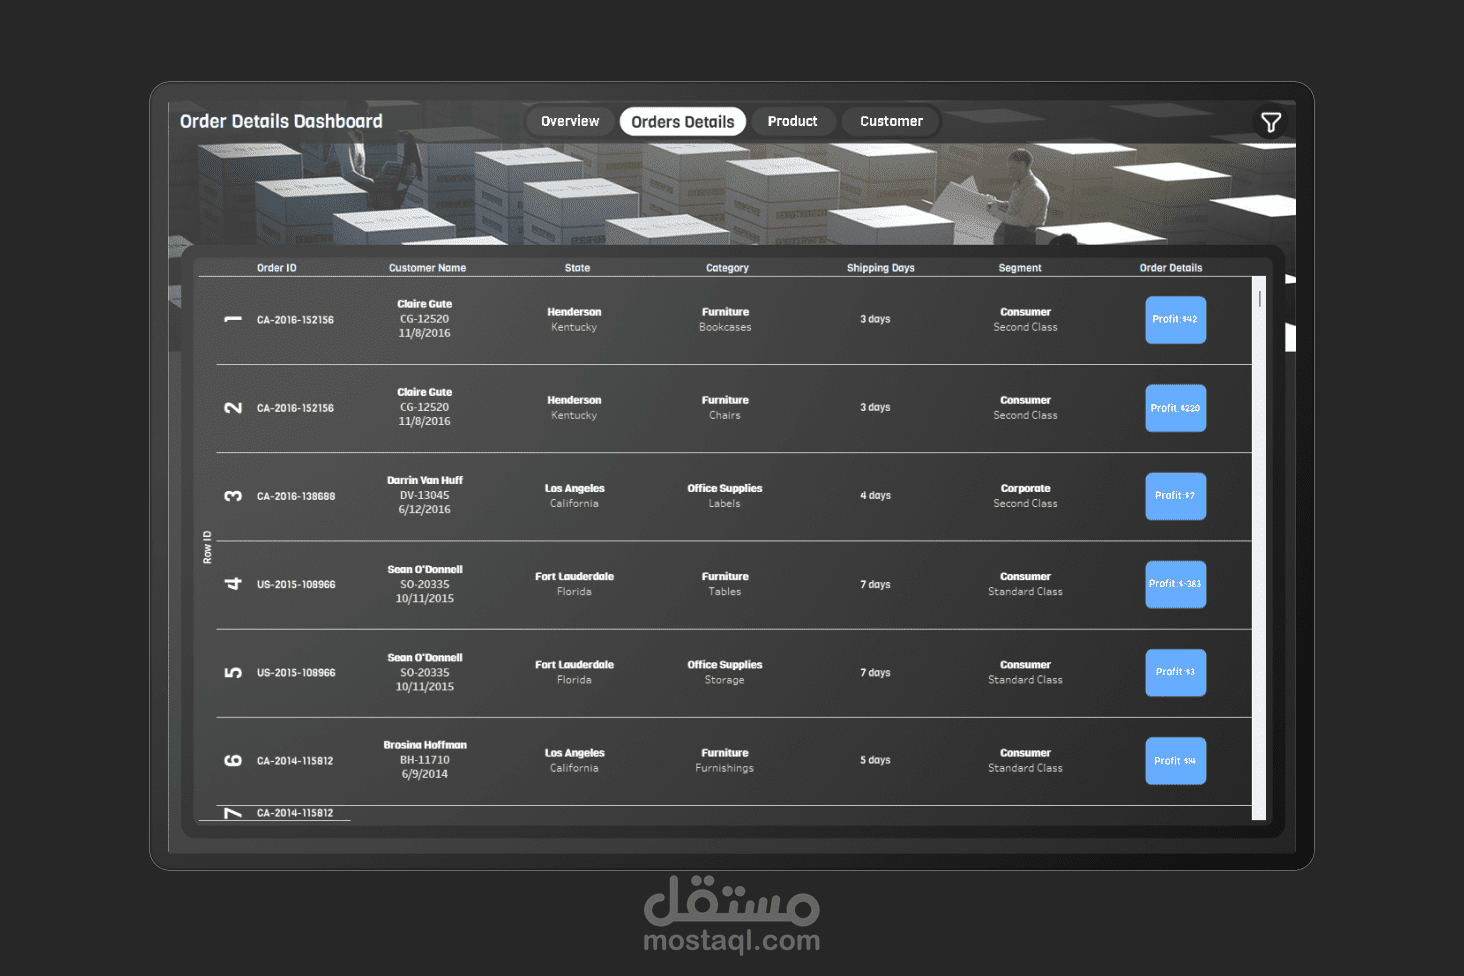
The Superstore Sales Analysis project is a data analytics initiative aimed at uncovering actionable insights from a retail dataset spanning 2014 to 2017. The project focused on analyzing sales, profit, customer behavior, and operational trends across product categories and regions to drive strategic business decisions.
Key Contributions:
Dashboard Design with Figma: Designed a sleek, user-centric dashboard template using Figma, providing a visually intuitive foundation for interactive data exploration in Tableau.
Data Cleaning with Python: Utilized Python (Pandas) to preprocess the dataset, addressing missing values, standardizing date formats, and ensuring data quality for robust analysis.
Star Schema Implementation: Developed a star schema to structure data into fact and dimension tables, optimizing it for efficient querying and seamless integration with Tableau.
Interactive Tableau Dashboards: Created dynamic dashboards in Tableau, incorporating parameters to filter by year (2014–2017) and key metrics (Sales, Profit, Customers, Orders, Quantity Sold). Visualizations included sales by category (e.g., Technology: $225,718 in 2016), customer insights, and order trends, with interactive filters for in-depth analysis.