Sales Performance Analysis
تفاصيل العمل
Comprehensive Sales Performance Analysis: Uncovering Strengths & Weaknesses!
In this analysis, I performed key calculations, including:
Profits
Cost per product
Selling price per product
Comparing cost vs. profit to determine product status (Profit - Loss - Break-even)
Then, I moved on to data visualization to extract clear insights:
Key Analysis Points:
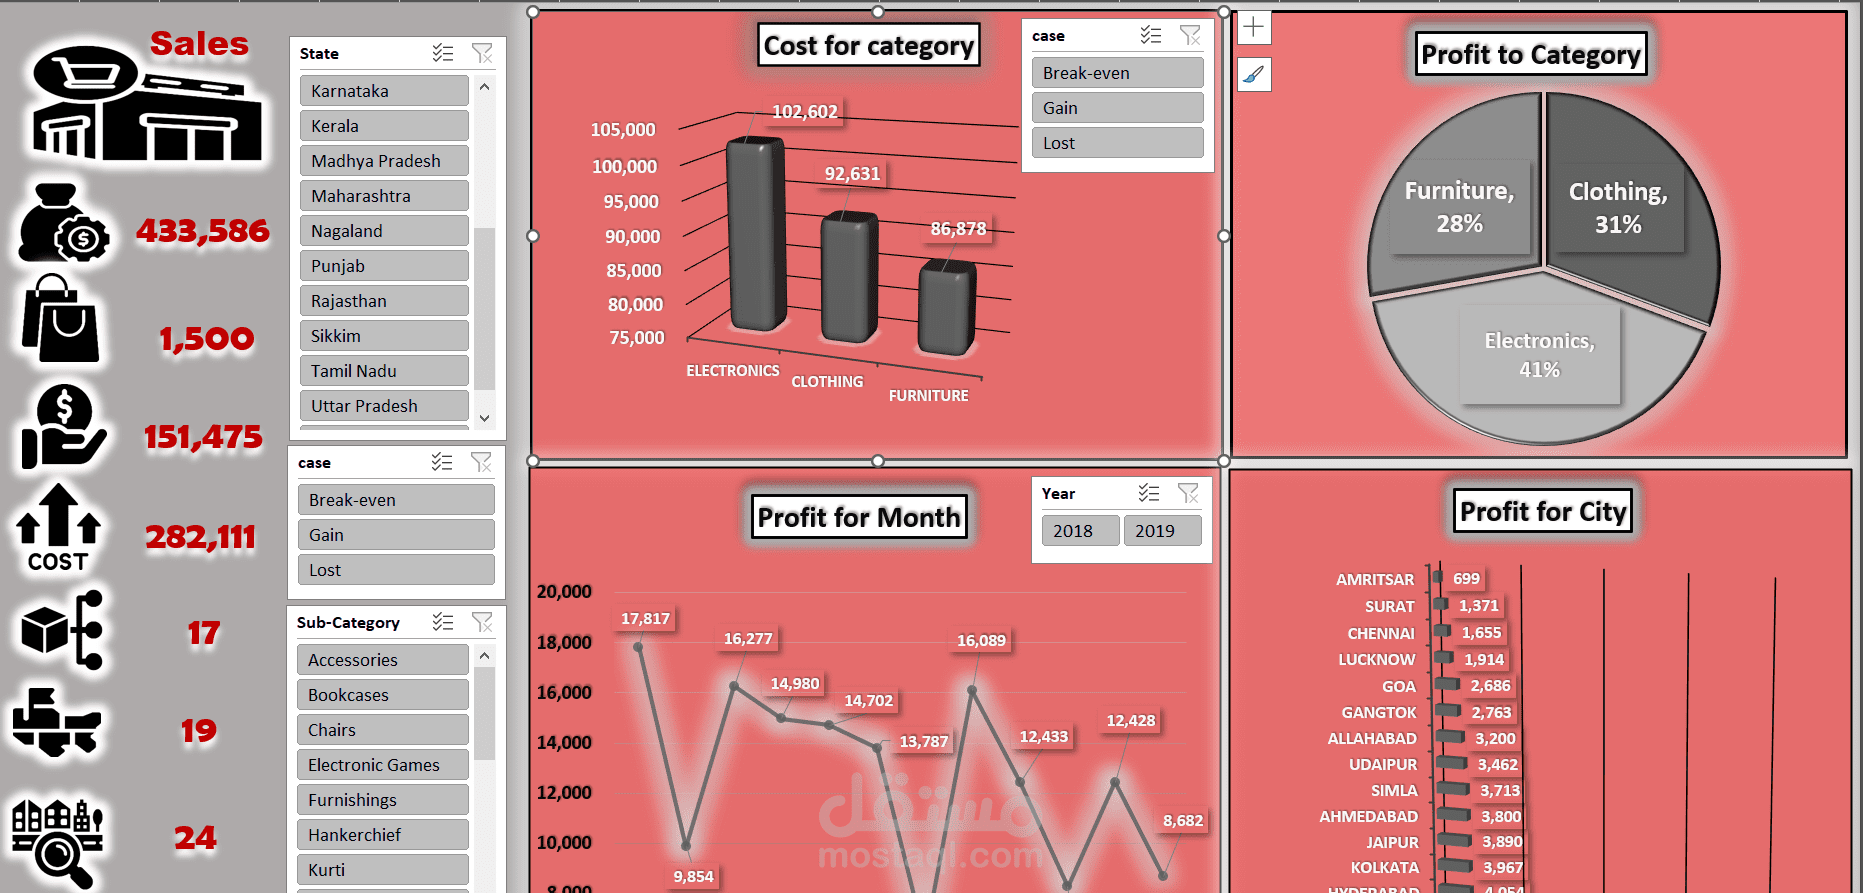
1️⃣ Comparing profits across departments to identify the most profitable categories.
2️⃣ Comparing costs across departments to understand their impact on profitability.
3️⃣ Analyzing profits by months and countries to identify seasonal and geographical differences.
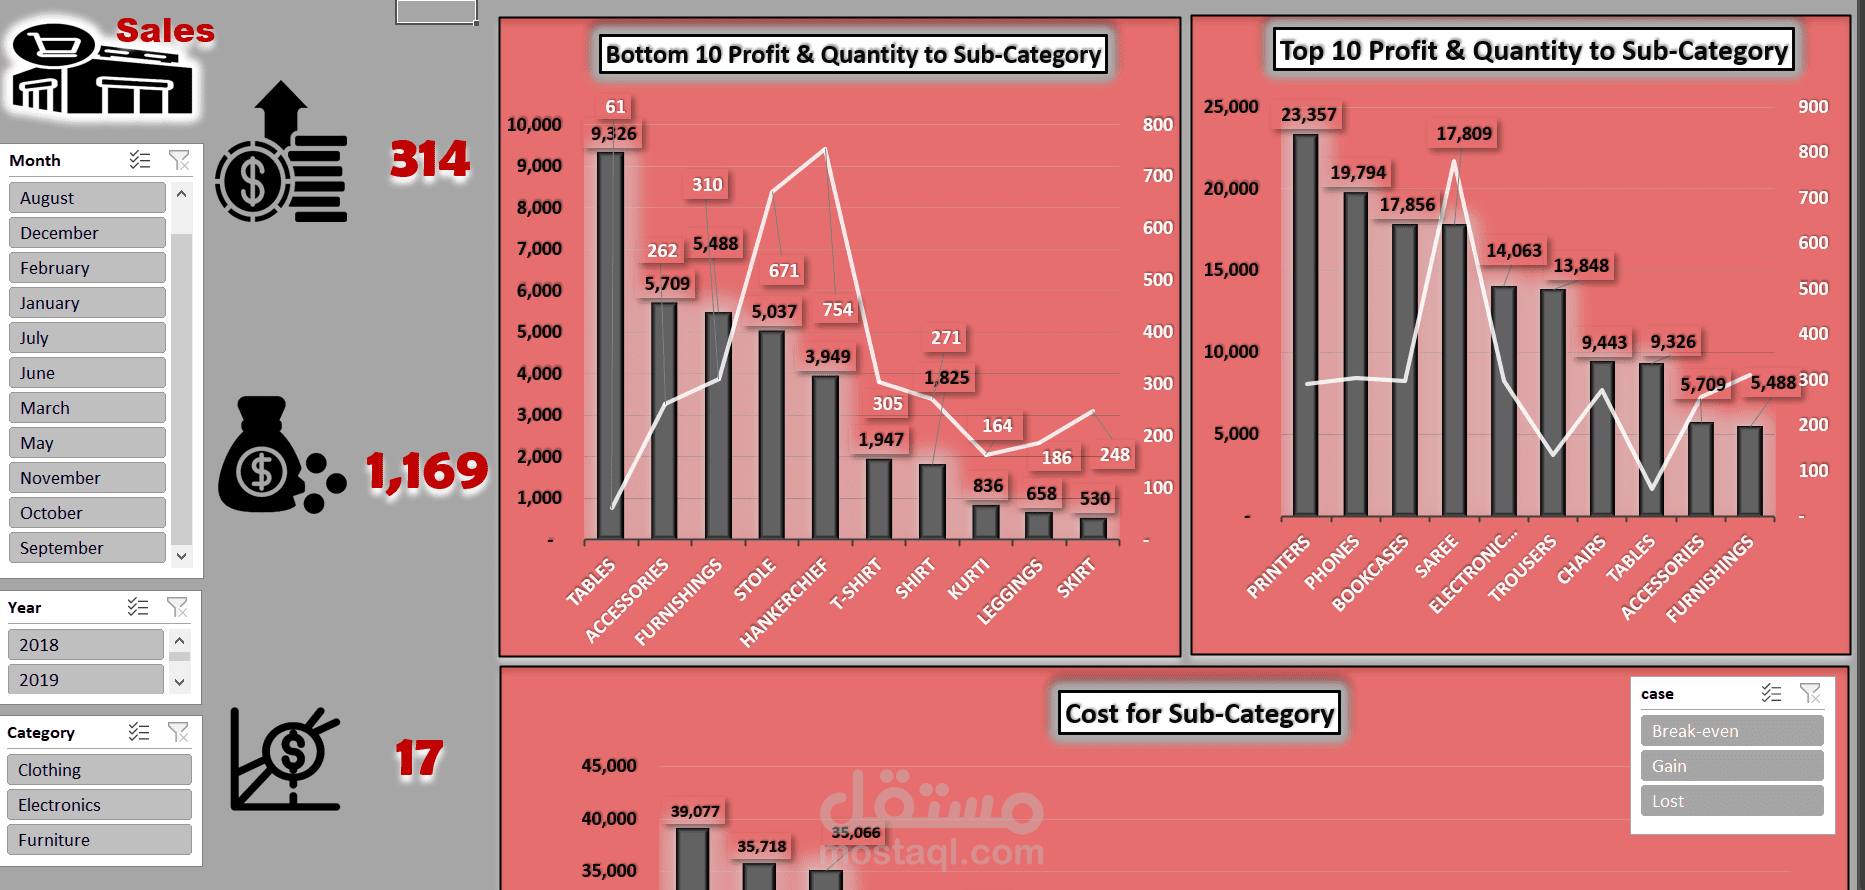
4️⃣ Identifying the most and least profitable products while analyzing sold quantities.
5️⃣ Comparing product costs to gain a clearer view of profit margins.
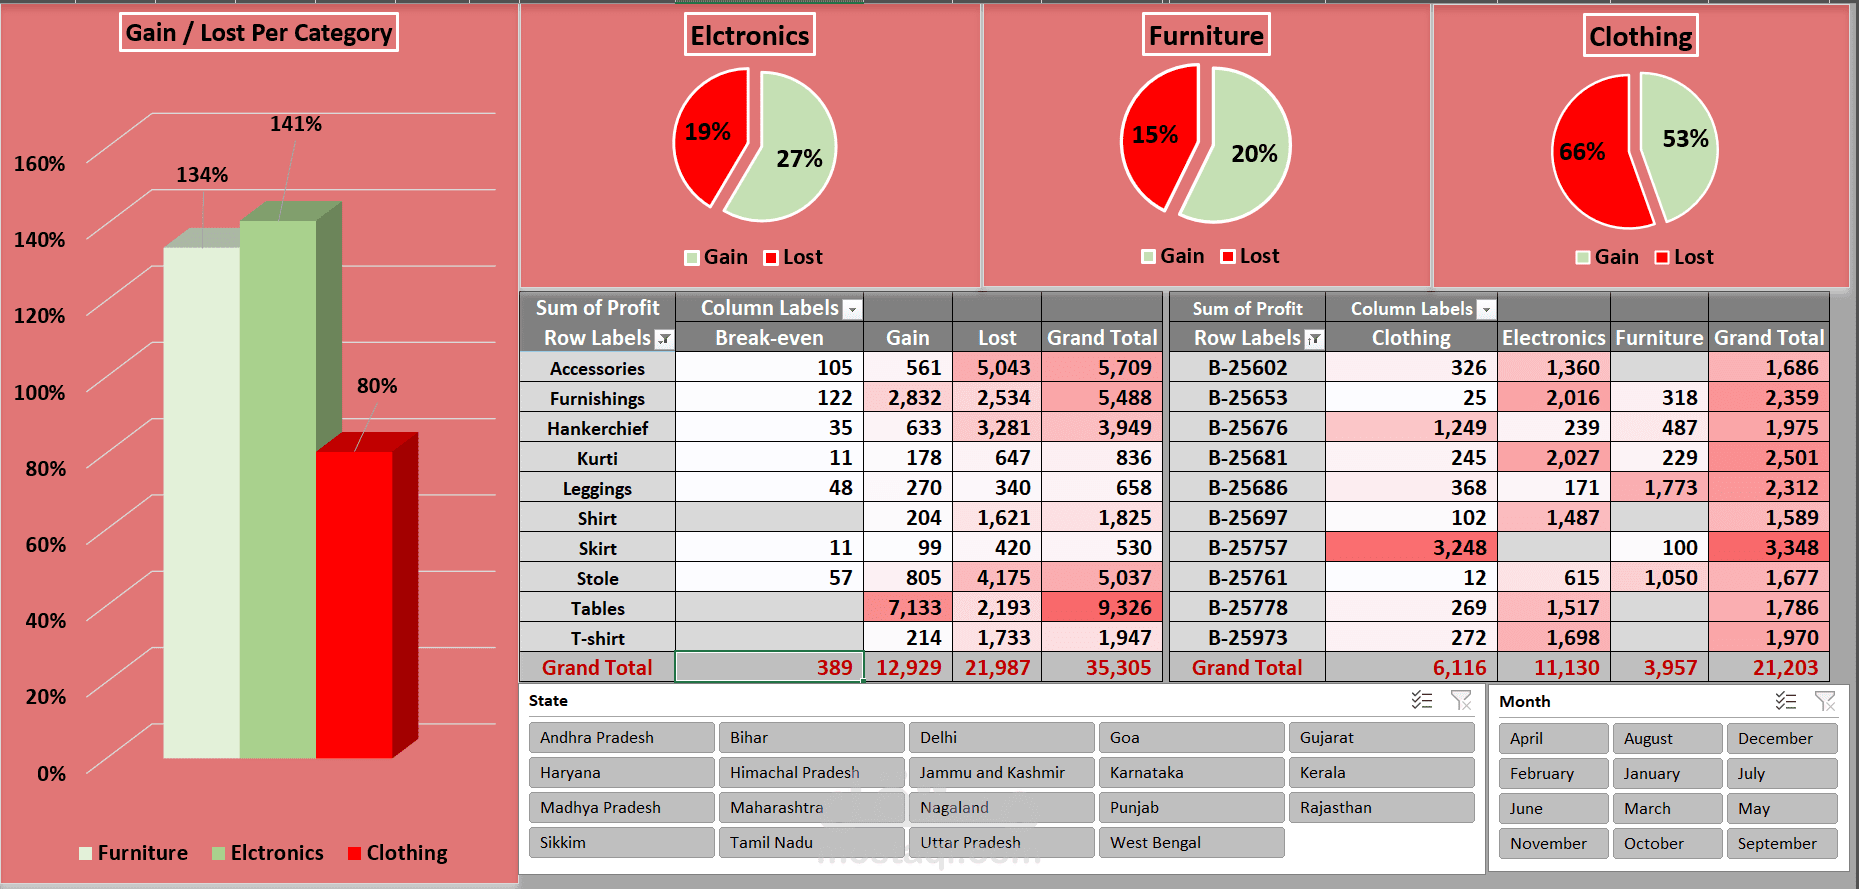
6️⃣ Two detailed tables:
Top profitable orders ?
Top 10 loss-making products , categorized by (Loss - Profit - Break-even).
7️⃣ Visuals showcasing the profit/loss ratio per department to assess sustainability.
8️⃣ Profit-to-loss ratio analysis for each department to identify improvement opportunities.
Key Findings:
Top Profitable Products:
1️⃣ T-shirts - Profit-to-cost ratio 27.6%
2️⃣ Accessories - Profit-to-cost ratio 22.2%
3️⃣ Shirts - Profit-to-cost ratio 19.7%
️ Top Loss-Making Products:
Tables - Loss -27.8%
Electronic Games - Loss -4.9%
Saree - Weak profit margin 1.03%
Monthly Profit Analysis:
Most Profitable Month:
January - 17,817
️ Least Profitable Month:
July - 6,160
Interesting Trends:
January is the highest revenue month, indicating strong demand or peak season promotions.
July is the lowest, possibly due to reduced summer demand.
November (8,266) and December (8,682) show relatively low performance, requiring sales support strategies.
Recommendations to Improve Financial Performance:
Strengthen promotional campaigns in July and November to counter profit dips.
Leverage high demand in January and August with sufficient stock and strong marketing.
Re-evaluate pricing strategies for low-profit categories like SKIRT, LEGGINGS, and KURTI.
Focus on high-performing categories such as PRINTERS, BOOKCASES, and SAREE.
Analyze customer behavior and optimize promotions to boost profitability.