Sales And Budget Dashboard
تفاصيل العمل

Driving Strategic Business Decisions Through Comprehensive Data Analysis
This portfolio showcases my ability to transform raw data into actionable insights using robust business intelligence tools and methodologies. By analyzing key performance indicators (KPIs) related to sales and budget, I can provide a holistic understanding of business performance, identify areas of strength and opportunity, and ultimately drive strategic decision-making.
Performance Against Goals and Forecasts :
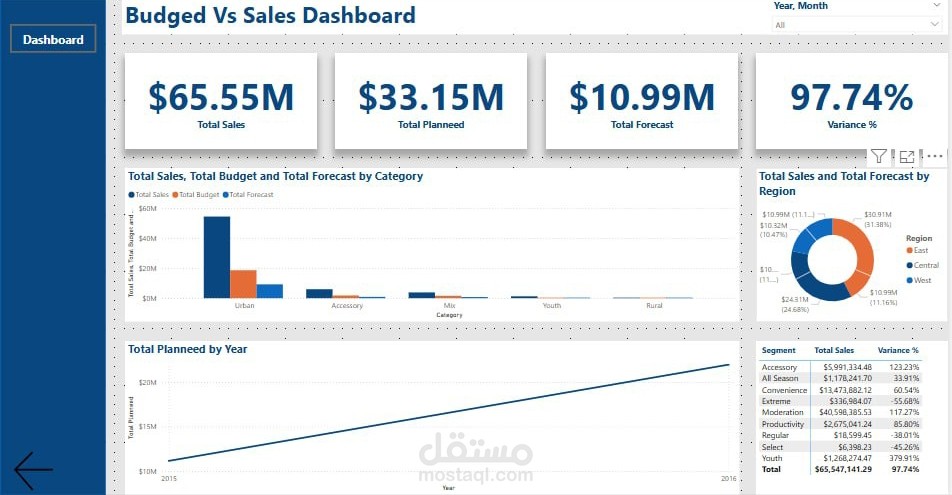
The analysis of the "Budgeted Vs Sales Dashboard" reveals a strong overall sales performance, exceeding the planned targets by a significant margin (Total Sales of \$65.55M vs. Total Planned of \$33.15M, resulting in a 97.74% positive variance). This indicates effective sales strategies and strong market reception. However, it's crucial to note that the Total Forecast (\$10.99M) is considerably lower than both the actual sales and the initial plan, suggesting a potential need to re-evaluate forecasting models or anticipate future market shifts.
A deeper dive into category performance shows that the "Urban" segment is a key driver of sales, consistently outperforming both budget and forecast. Conversely, analyzing the variance by product segment highlights specific areas needing attention, such as the "Regular" segment, which shows a notable negative variance (-38.01%), indicating potential underperformance or issues requiring investigation. The "Accessory" segment, on the other hand, demonstrates exceptional overperformance (123.23%), suggesting a significant growth opportunity.
Profitability and Revenue Generation :
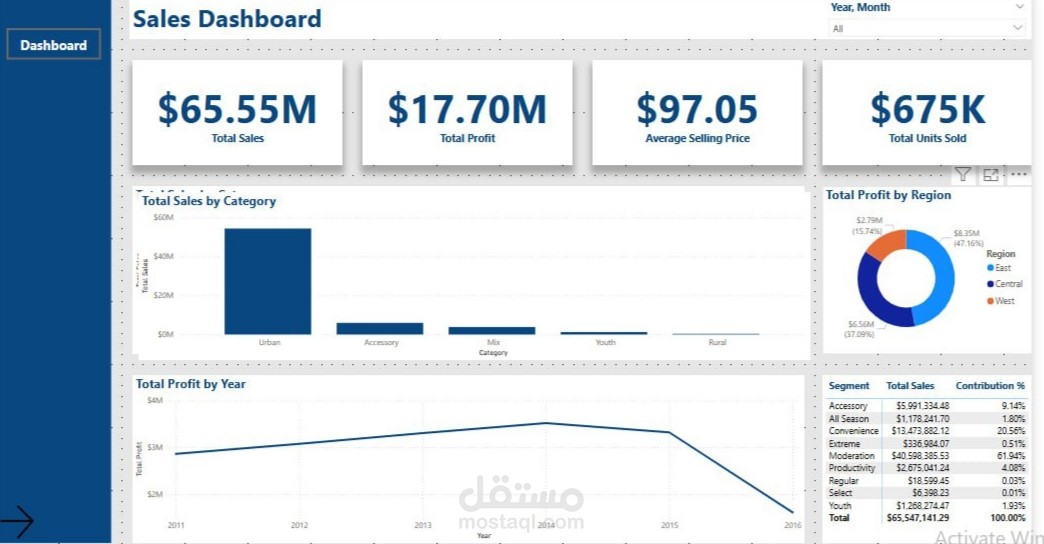
The "Sales Dashboard" complements this analysis by providing critical insights into profitability. The total sales of \$65.55M generated a Total Profit of \$17.70M, with an Average Selling Price of \$97.05 across 675K units sold. Understanding profit margins at a regional level reveals variations in profitability across different geographic areas, which may necessitate tailored strategies for each region. The trend of total profit over time indicates a peak around 2015, followed by a decrease in 2016, prompting further investigation into the factors contributing to this shift.
Analyzing sales contribution by segment identifies key revenue drivers. For instance, the "Convenience" segment contributes the largest share to the total sales. This granular understanding of segment performance allows for targeted marketing efforts and resource allocation to maximize profitability.
Underlying Data Structure for Robust Analysis :
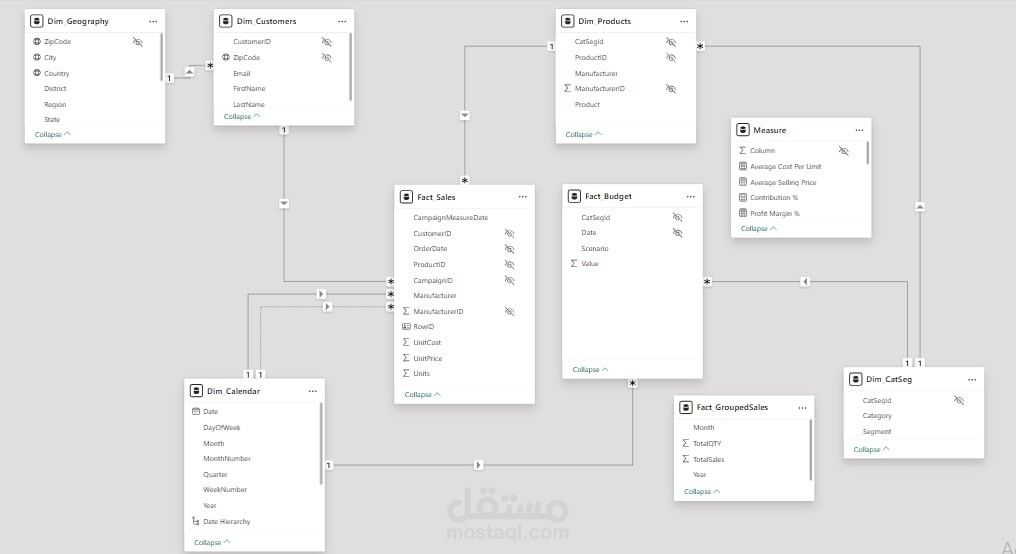
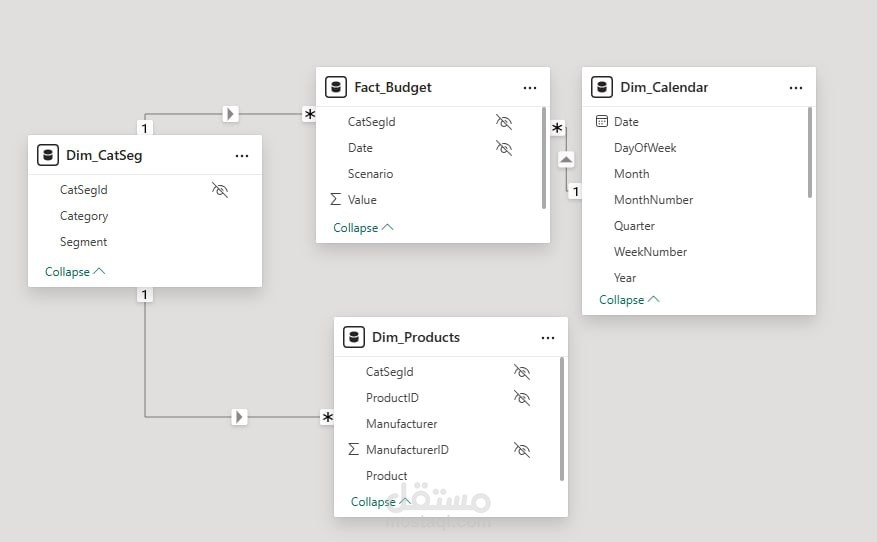
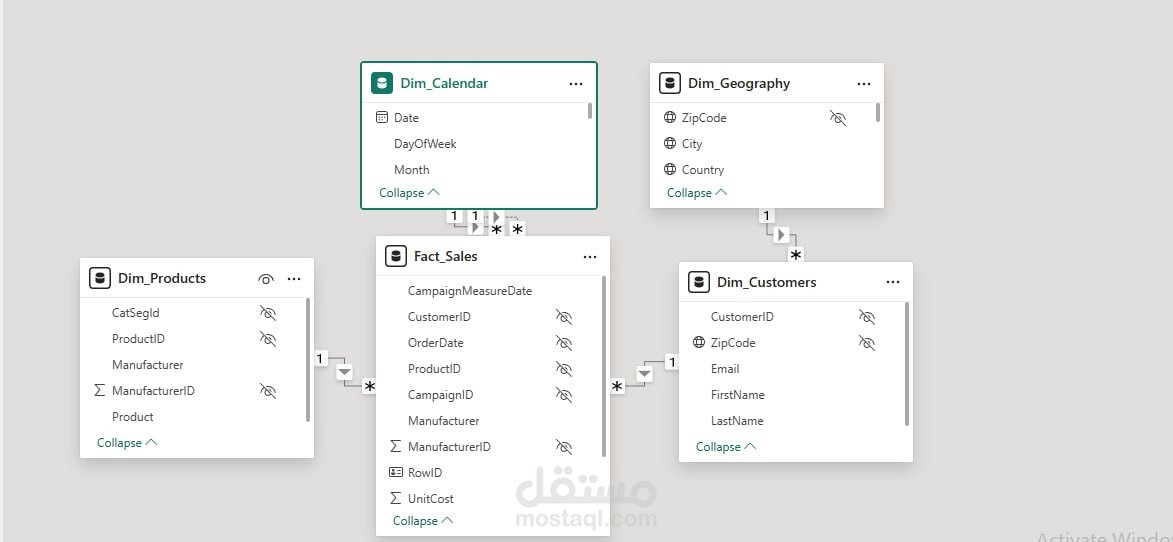
The effectiveness of these dashboards relies on a well-structured underlying data model. This model comprises several dimension tables (`Dim Geography`, `Dim Customers`, `Dim Products`, `Dim Calendar`, `Dim CatSeg`) that provide rich contextual information for the sales and budget data. These dimensions are linked to fact tables (`Fact Sales`, `Fact Budget`, `Fact GroupedSales`) containing the core transactional data.
Furthermore, a dedicated "Measure" table houses crucial calculated metrics such as Total Sales, Total Profit, Average Selling Price, Contribution %, and Variance %. These pre-calculated measures streamline the analysis and enable the creation of insightful visualizations within the dashboards. The relationships defined within the data model ensure data integrity and allow for seamless slicing and dicing of information across various dimensions, providing a comprehensive understanding of business performance from multiple perspectives.
Conclusion :
By integrating the analysis of sales performance against budget and forecasts with a detailed view of profitability and the underlying data structure, I provide a holistic and actionable understanding of business dynamics. This comprehensive approach empowers businesses to identify opportunities, address challenges, and make data-driven decisions that lead to improved performance and sustainable growth. My ability to connect these different facets of data analysis into a cohesive narrative demonstrates a strong understanding of business intelligence principles and the power of data in driving strategic outcomes.
قيادة قرارات الأعمال الاستراتيجية من خلال تحليل شامل للبيانات
تُبرز هذه المحفظة قدرتي على تحويل البيانات الخام إلى رؤى عملية باستخدام أدوات ومنهجيات فعّالة لذكاء الأعمال. من خلال تحليل مؤشرات الأداء الرئيسية (KPIs) المتعلقة بالمبيعات والميزانية، يُمكنني توفير فهم شامل لأداء الأعمال، وتحديد مواطن القوة والفرص، وفي نهاية المطاف، قيادة عملية اتخاذ القرارات الاستراتيجية.
الأداء مقارنةً بالأهداف والتوقعات:
يكشف تحليل "لوحة معلومات الميزانية مقابل المبيعات" عن أداء مبيعات قوي بشكل عام، متجاوزًا الأهداف المخطط لها بهامش كبير (إجمالي مبيعات 65.55 مليون دولار أمريكي مقابل إجمالي المبيعات المخطط لها 33.15 مليون دولار أمريكي، مما أدى إلى تباين إيجابي بنسبة 97.74%). وهذا يُشير إلى استراتيجيات مبيعات فعّالة وقبول قوي في السوق. ومع ذلك، من المهم ملاحظة أن إجمالي التوقعات (10.99 مليون دولار أمريكي) أقل بكثير من كل من المبيعات الفعلية والخطة الأولية، مما يُشير إلى ضرورة إعادة تقييم نماذج التنبؤ أو توقع تحولات السوق المستقبلية. يُظهر تحليل أداء الفئات بشكل أعمق أن قطاع "الحضري" هو المحرك الرئيسي للمبيعات، حيث يتفوق باستمرار على كلٍ من الميزانية والتوقعات. في المقابل، يُبرز تحليل التباين حسب قطاع المنتج جوانب محددة تحتاج إلى اهتمام، مثل قطاع "العادي"، الذي يُظهر تباينًا سلبيًا ملحوظًا (-38.01%)، مما يشير إلى ضعف محتمل في الأداء أو مشاكل تتطلب التحقيق. من ناحية أخرى، يُظهر قطاع "الملحقات" أداءً متفوقًا استثنائيًا (123.23%)، مما يُشير إلى فرصة نمو كبيرة.
الربحية وتوليد الإيرادات:
تُكمل "لوحة معلومات المبيعات" هذا التحليل من خلال توفير رؤى مهمة حول الربحية. بلغ إجمالي المبيعات 65.55 مليون دولار أمريكي، وحقق ربحًا إجماليًا قدره 17.70 مليون دولار أمريكي، بمتوسط سعر بيع قدره 97.05 دولار أمريكي لـ 675 ألف وحدة مباعة. يكشف فهم هوامش الربح على المستوى الإقليمي عن تباينات في الربحية عبر مختلف المناطق الجغرافية، مما قد يستلزم استراتيجيات مصممة خصيصًا لكل منطقة. يشير اتجاه إجمالي الربح بمرور الوقت إلى ذروة في عام ٢٠١٥ تقريبًا، تلتها انخفاضات في عام ٢٠١٦، مما يستدعي إجراء المزيد من البحث في العوامل المساهمة في هذا التحول.
يُحدد تحليل مساهمة المبيعات حسب القطاع محركات الإيرادات الرئيسية. على سبيل المثال، يُساهم قطاع "الراحة" بأكبر حصة في إجمالي المبيعات. يسمح هذا الفهم الدقيق لأداء القطاع ببذل جهود تسويقية مُستهدفة وتخصيص الموارد لتحقيق أقصى قدر من الربحية.
هيكل البيانات الأساسي لتحليل دقيق:
تعتمد فعالية لوحات المعلومات هذه على نموذج بيانات أساسي مُهيكل جيدًا. يتألف هذا النموذج من عدة جداول أبعاد (`Dim Geography`،`Dim Customers`،`Dim Products`،`Dim Calendar`،`Dim CatSeg`) تُوفر معلومات سياقية غنية لبيانات المبيعات والميزانية. ترتبط هذه الأبعاد بجداول البيانات (مبيعات البيانات، وميزانية البيانات، ومبيعات البيانات المجمعة) التي تحتوي على بيانات المعاملات الأساسية.
علاوة على ذلك، يحتوي جدول "القياس" المخصص على مقاييس محسوبة مهمة، مثل إجمالي المبيعات، وإجمالي الربح، ومتوسط سعر البيع، ونسبة المساهمة، ونسبة التباين. تُبسط هذه المقاييس المحسوبة مسبقًا عملية التحليل، وتُتيح إنشاء تصورات ثاقبة داخل لوحات المعلومات. تضمن العلاقات المُحددة داخل نموذج البيانات سلامة البيانات، وتتيح تقسيم المعلومات وتجزئتها بسلاسة عبر أبعاد مُختلفة، مما يُوفر فهمًا شاملًا لأداء الأعمال من وجهات نظر مُتعددة.
الخلاصة:
من خلال دمج تحليل أداء المبيعات مقابل الميزانية والتوقعات مع عرض مُفصل للربحية وهيكل البيانات الأساسي، أُقدم فهمًا شاملًا وعمليًا لديناميكيات الأعمال. يُمكّن هذا النهج الشامل الشركات من تحديد الفرص، ومواجهة التحديات، واتخاذ قرارات قائمة على البيانات، مما يُؤدي إلى تحسين الأداء والنمو المُستدام. إن قدرتي على ربط هذه الجوانب المختلفة لتحليل البيانات في سرد متماسك يوضح فهمي القوي لمبادئ الاستخبارات التجارية وقوة البيانات في تحقيق النتائج الاستراتيجية.