Power BI Project: Sales & Employee Performance Insights
تفاصيل العمل
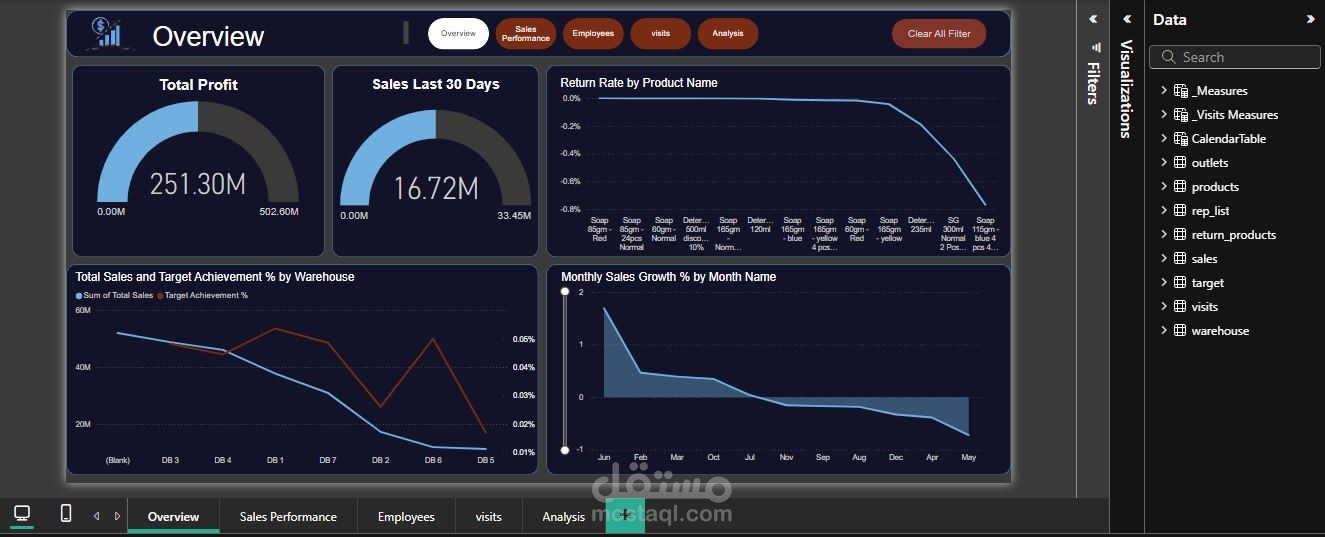
I recently completed a Power BI project to analyze sales, employee performance, and visits. Here’s a quick overview:
1. Data Cleaning ?
Used Power Query to clean data from tables like sales, visits, and warehouse.
Removed duplicates, handled missing values (e.g., null visits set to 0), standardized data types (e.g., sales as currency), and filtered outliers.
Established table relationships using keys like warehouse_name.
2. Types of Analysis
Descriptive: Total Profit ($25.13M), Sales Last 30 Days ($16.72M), Total Visits (127.11K).
Time-Series: Monthly Sales Growth % and Visits Growth % trends.
Comparative: Sales vs. Target by employee and warehouse, regional sales breakdown.
Diagnostic: High return rates by product (e.g., Soap 85gm - Green at 0.4%).
3. Key Findings
Sales: $25.36M against a $512.72M target (only 5% achieved). Sales growth dropped 100% from Jan to May.
Top Performers: Amgad led with $1.5M in sales; Delta region contributed 29.29% ($52.92M).
Visits: 127.11K total visits, 846.07% monthly growth, with February as the peak month (~25K visits).
Concerns: High return rates for certain products and underperforming regions (e.g., Cairo at 78.84M).
This dashboard provides actionable insights to improve sales strategies, employee performance, and customer engagement.