PowerBI Dashboard
تفاصيل العمل
This project involved several key steps:
Data Collection & Integration
Data Preprocessing: Using Excel PowerQuery and Python to prepare the data for analysis and visualization:
Checking for and removing duplicates
Handling missing values
Detecting and correcting outliers
Standardizing and formatting data
Checking and changing data types
Documenting the data cleaning process
Data Storage: Storing the cleaned data
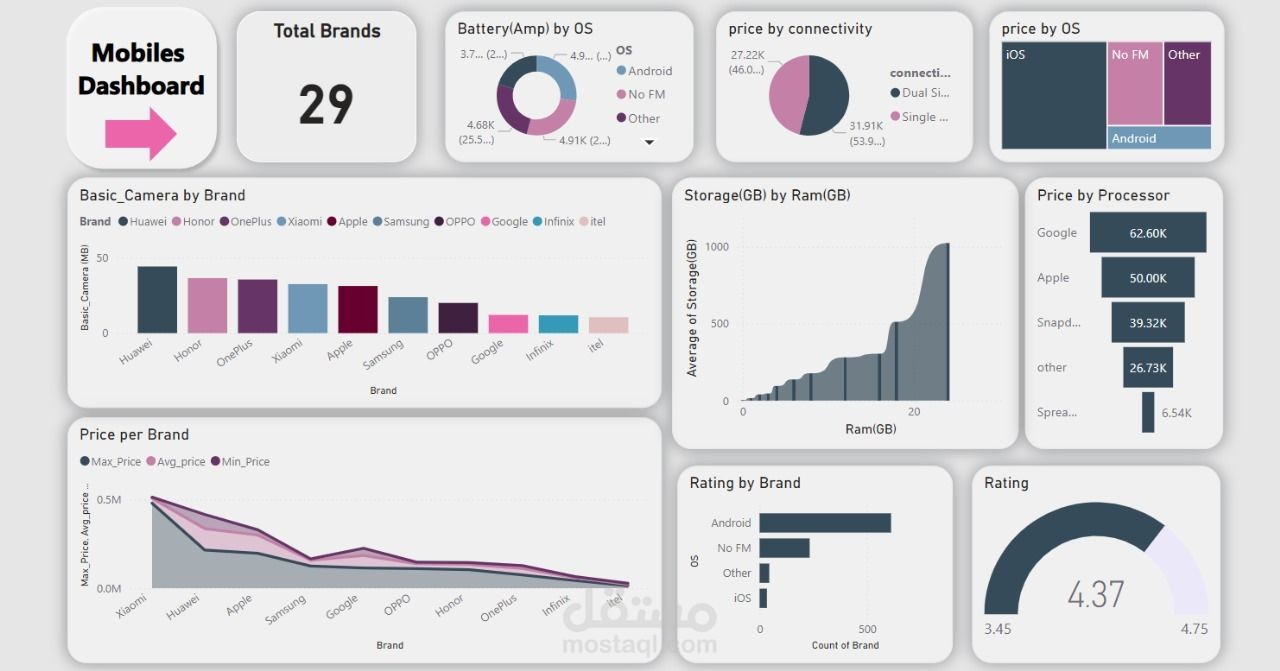
Data Visualization: Creating an interactive dashboard with insights using Power BI
I’ve included visualizations for:
Sales over time
Number of brands
Connection between price & brands
Connection between price & connectivity
Connection between price & processor
Connection between RAM & storage
Rating per brand
Connection between price & OS
And more...
This project helped me hone my skills in Power BI features, DAX, custom visuals and data modeling