Terrorism in North Sinai, Egypt a comprehensive spatial, spatiotemporal analysis
تفاصيل العمل
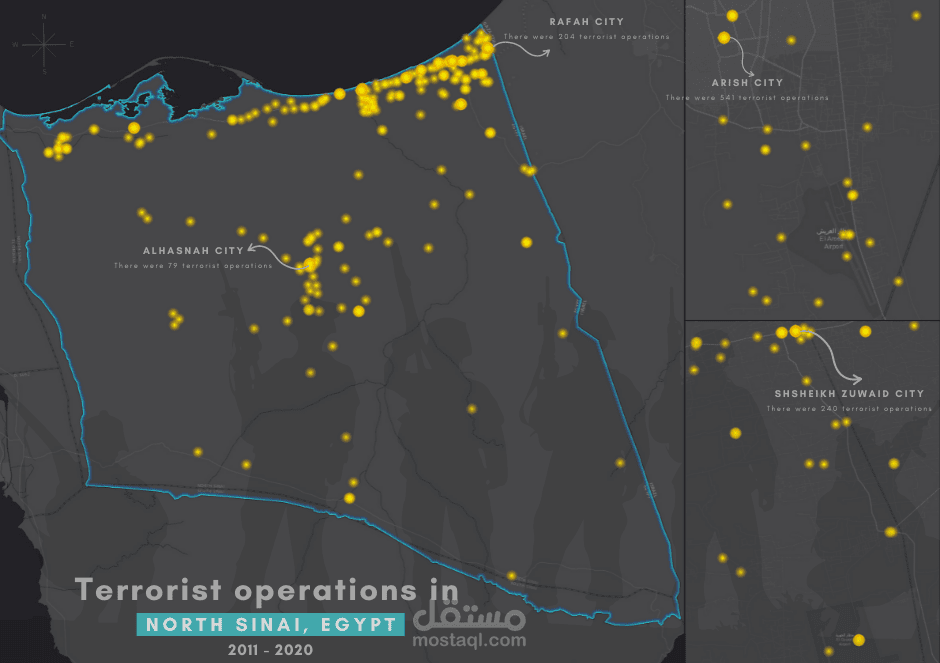
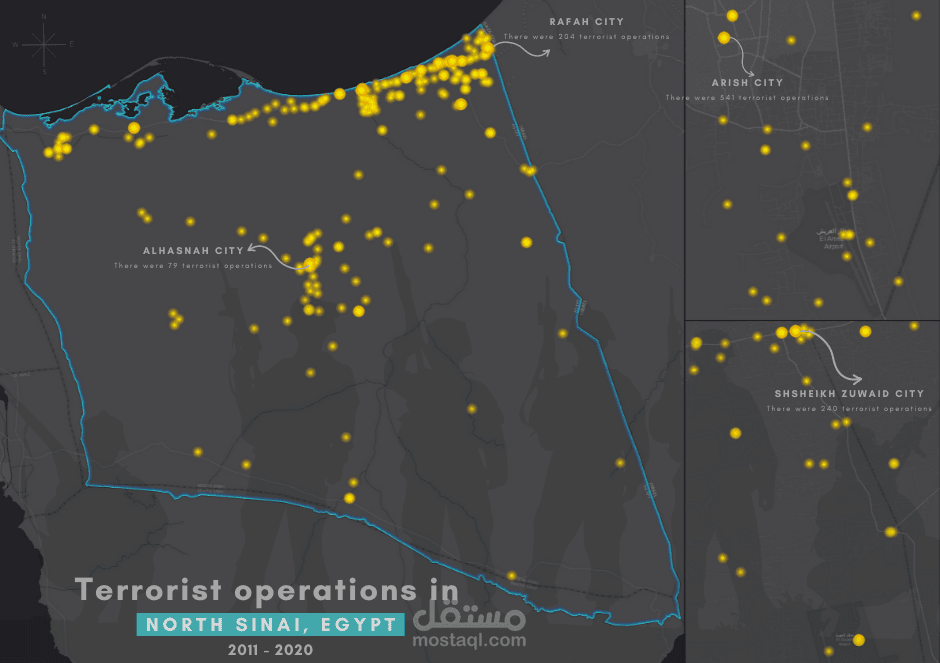
"Terrorism in North Sinai, Egypt: a comprehensive spatial, spatiotemporal analysis"
Knowledge of the spatial and temporal characteristics of terrorist events is essential to reduce terrorist events and loss of life and property. In this context, it highlights the significant benefits that Geographic Information Systems (GIS) technology can provide in analyzing spatial data related to terrorism.
This technology helps identify areas most affected by terrorism by analyzing geographical and temporal data, enabling authorities to take more effective preventive measures. GIS can contribute to improving the response of security agencies and better directing resources, which enhances security and safety in communities.
Therefore, we must invest in this technology and its applications to enhance our capabilities to confront terrorist challenges and achieve a safer environment.
Hot Spots analysis
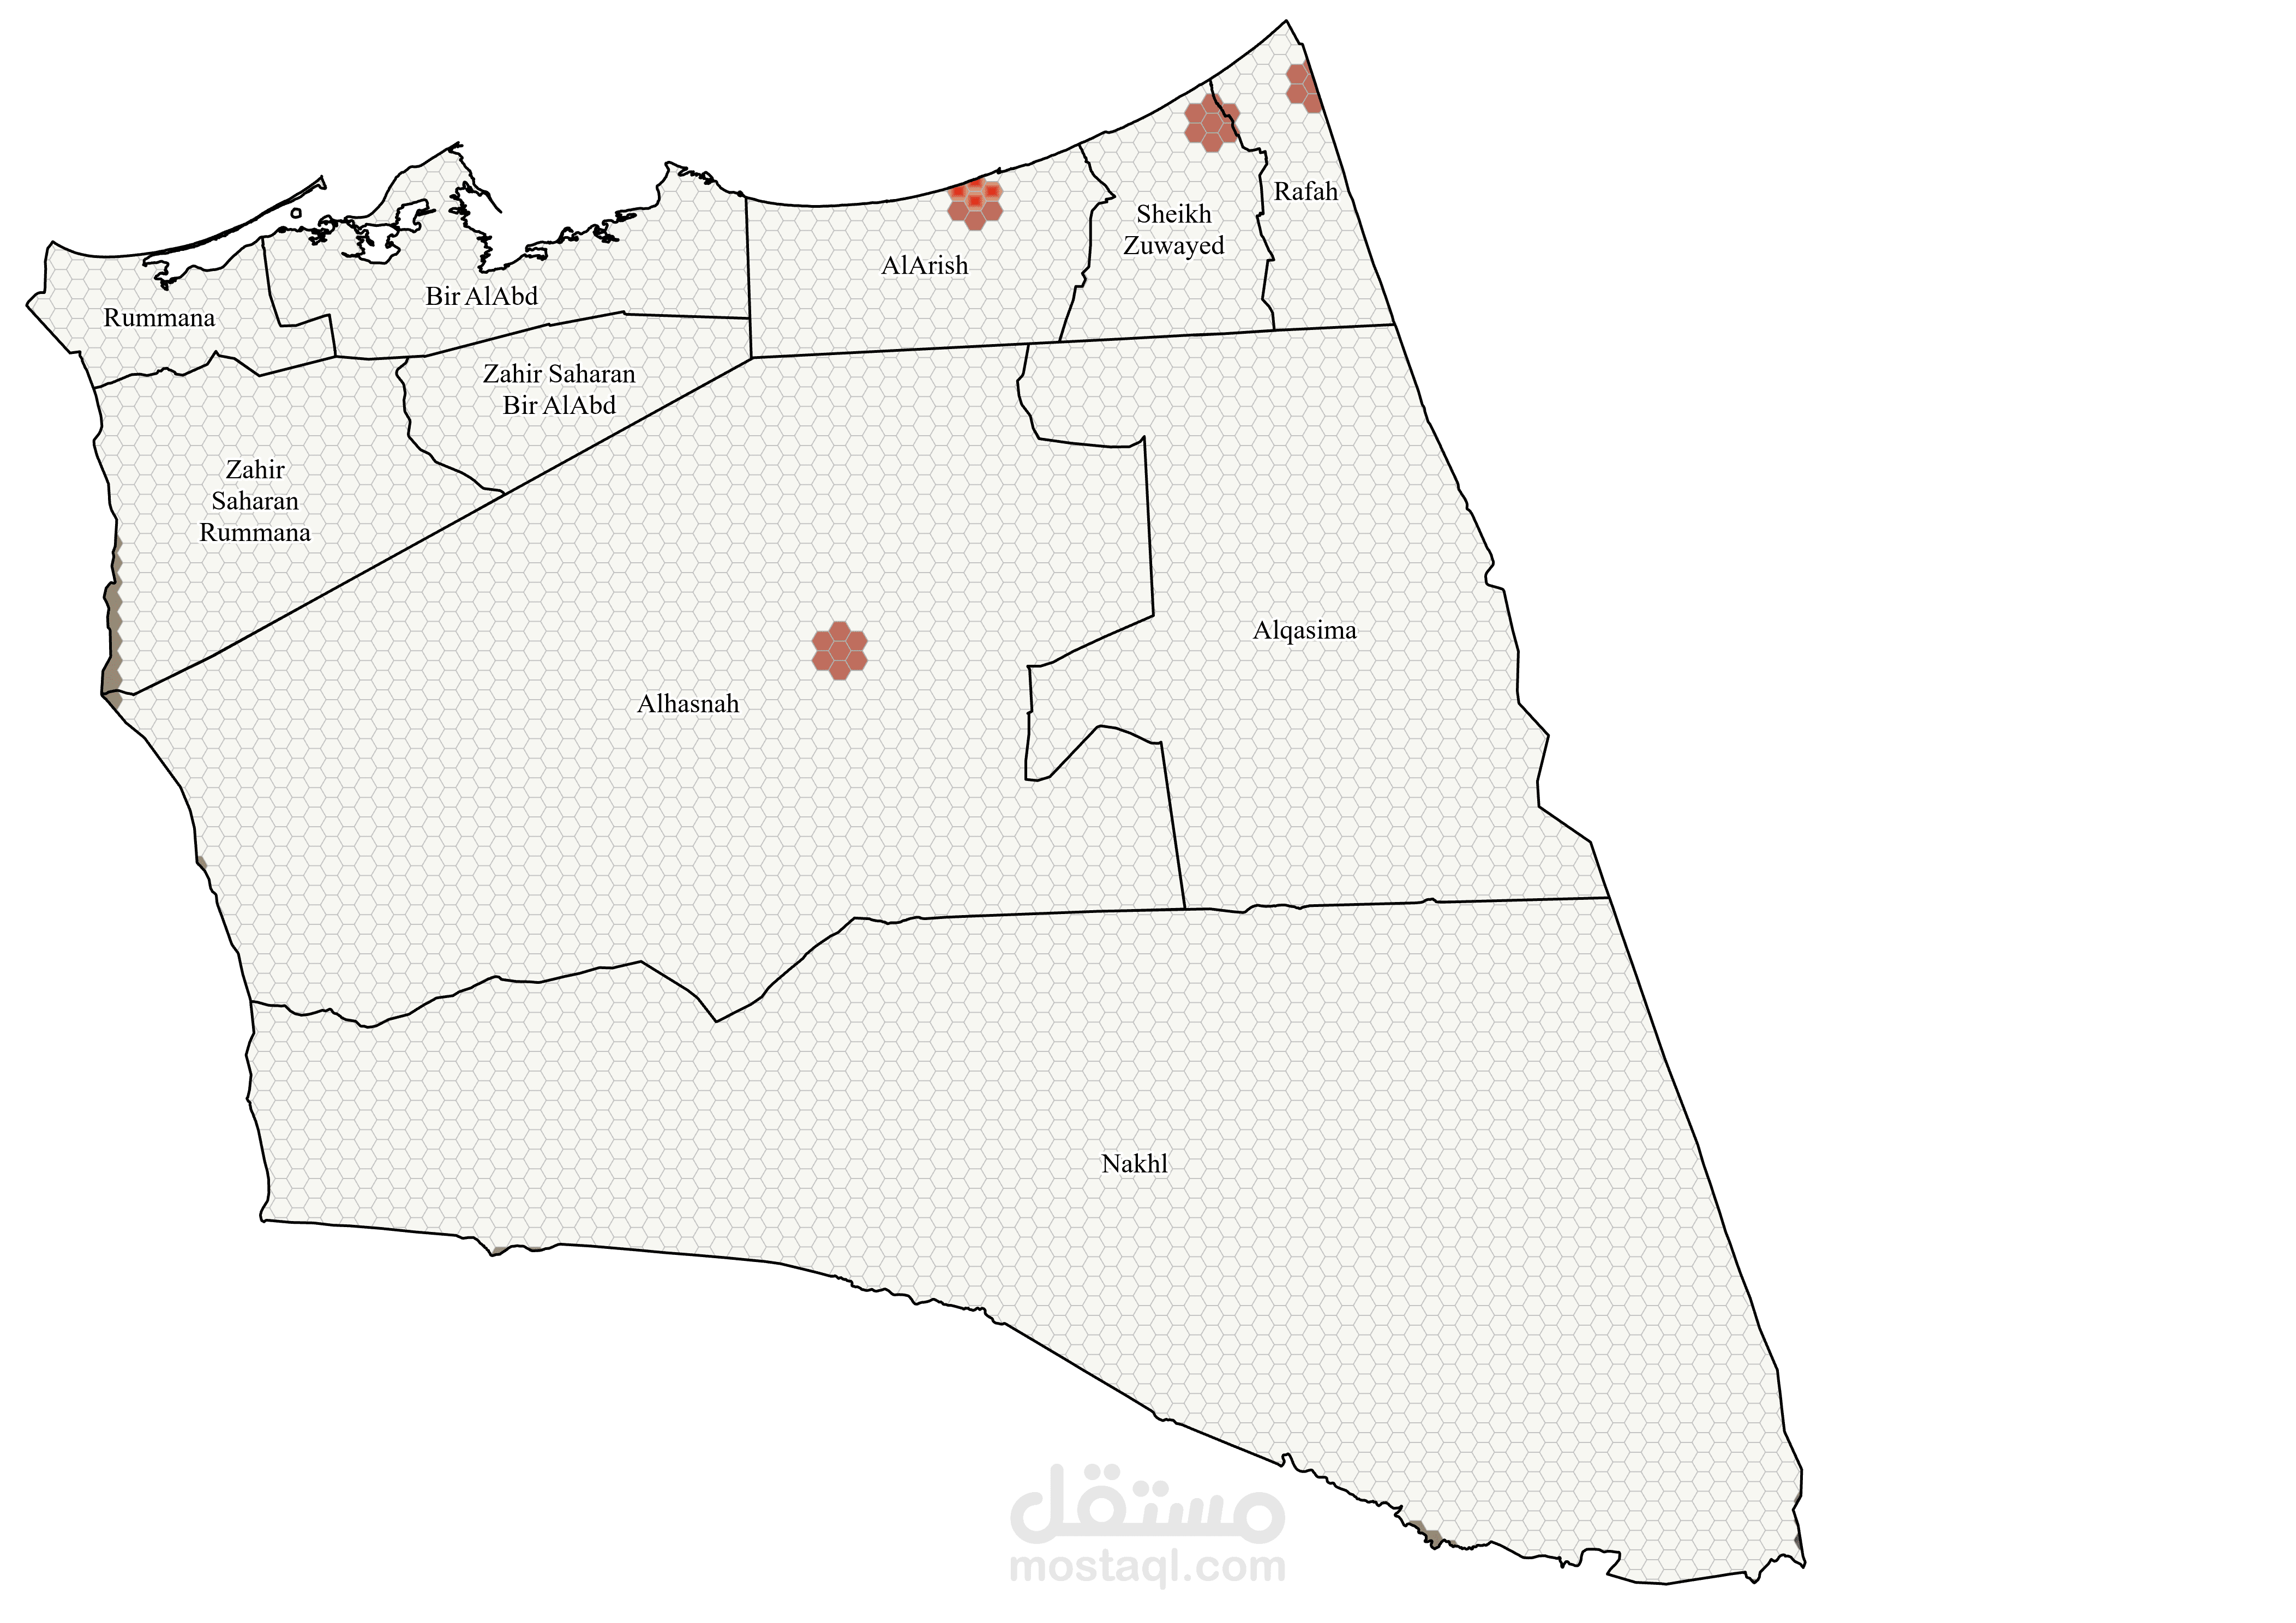
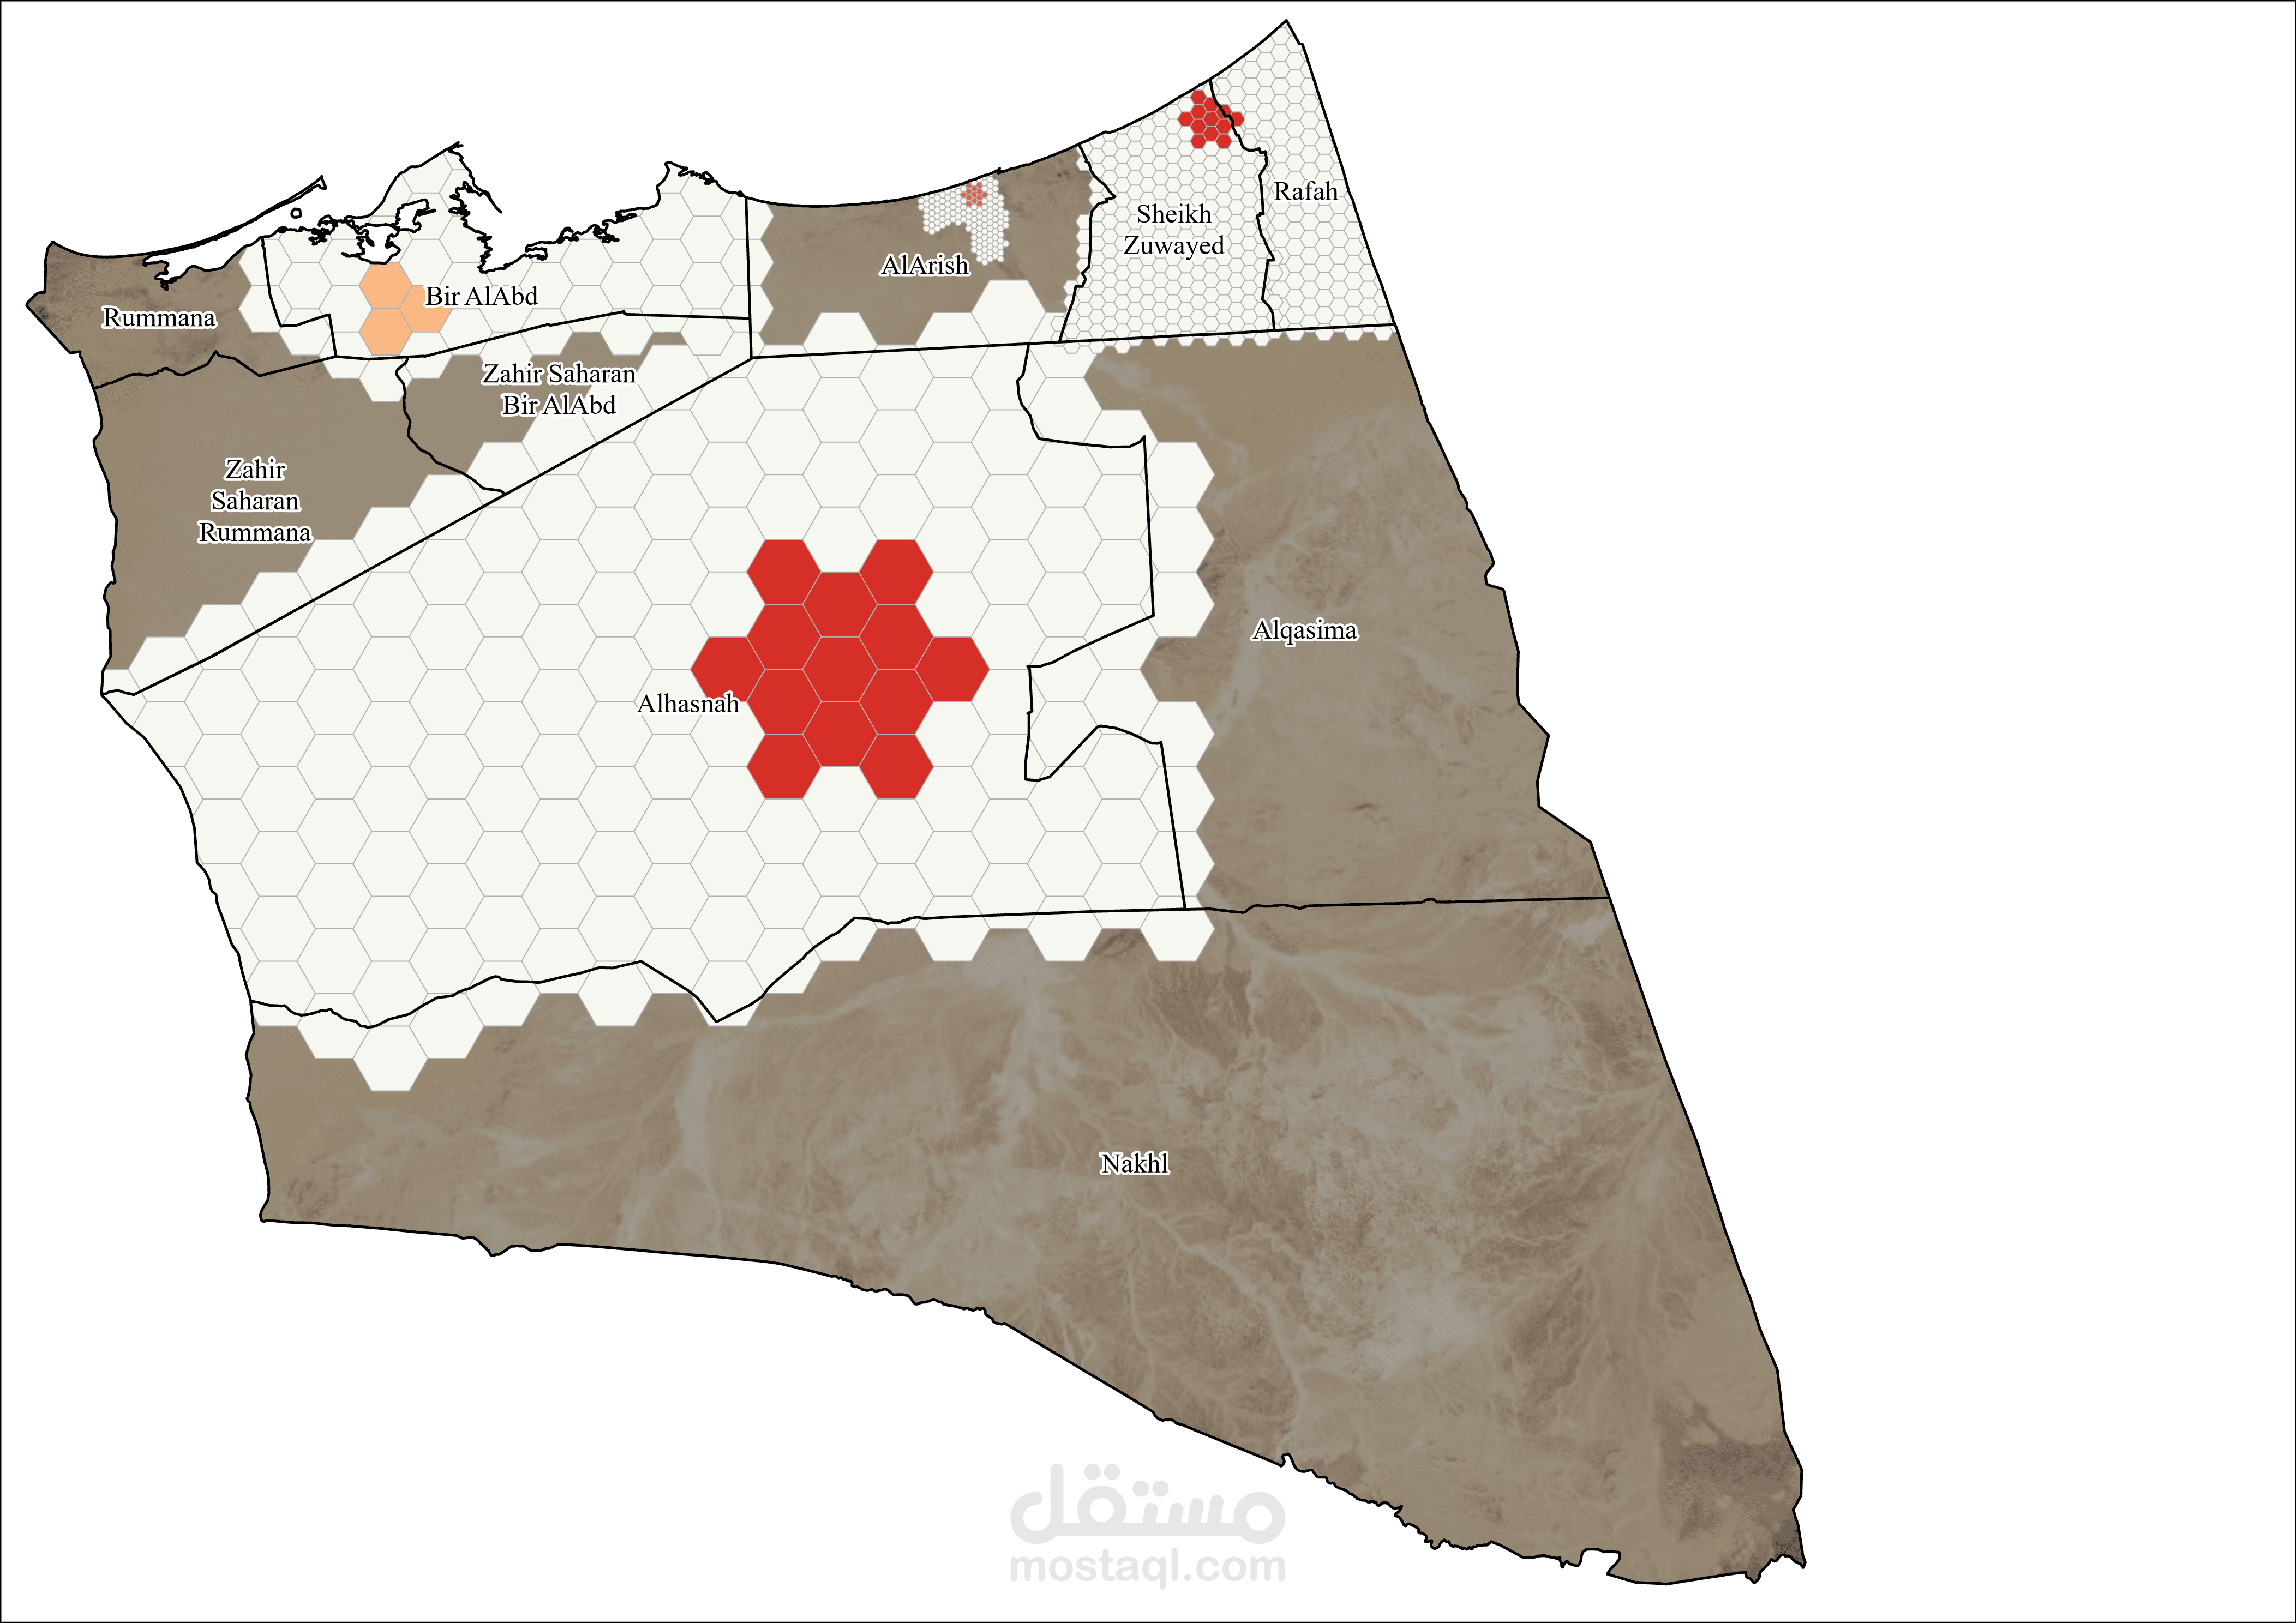
One district showed a new hotspot pattern, “Intensifying“is located in Arish city. As for the other areas, the Consecutive pattern appeared. Consecutive: a single uninterrupted run of hot time step intervals, comprised of less than 90% of all intervals.
Intensifying: A location that has been a statistically significant hotspot for 90 percent of the time step intervals, including the final time step. In addition, the intensity of clustering of high counts in each time step is increasing overall, and that increase is statistically significant.
Hot Spots by Area analysis in North Sinai
The Hot Spots by Area analysis identifies high concentrations of incidents in each area of interest rather than the study area as a whole. This type of analysis reveals subtle patterns and supports the direction of efforts within a defined area of responsibility. Essentially, it runs a hot spot analysis for each area in the Input Area Of Interest Features.
The Count Incidents By LOC analysis
Calculates the frequency of incidents near Lines of Communication (LOCs). LOCs can be roads, trails, or rails. The output is symbolized with a graduated color symbol to indicate areas with greater frequency of events. Count Incidents by LOC works by first determining the events that are within a search radius of LOC segments and then counting the number of events for each segment. Analysis Results on the Danger of Roads in North Sinai The analysis revealed that the city of Arish experienced over 600 terrorist attacks on its roads, making it the most dangerous in Sinai during that period. Sheikh Zuweid ranked second with more than 350 attacks, followed by Rafah with 250 attacks.
Spatiotemporal analysis of terrorist attacks
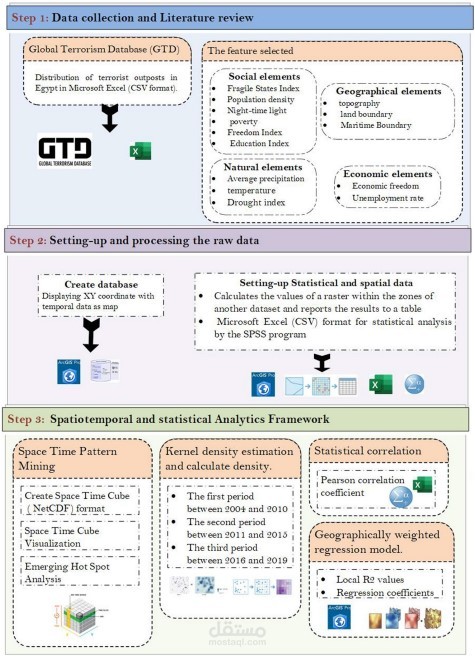
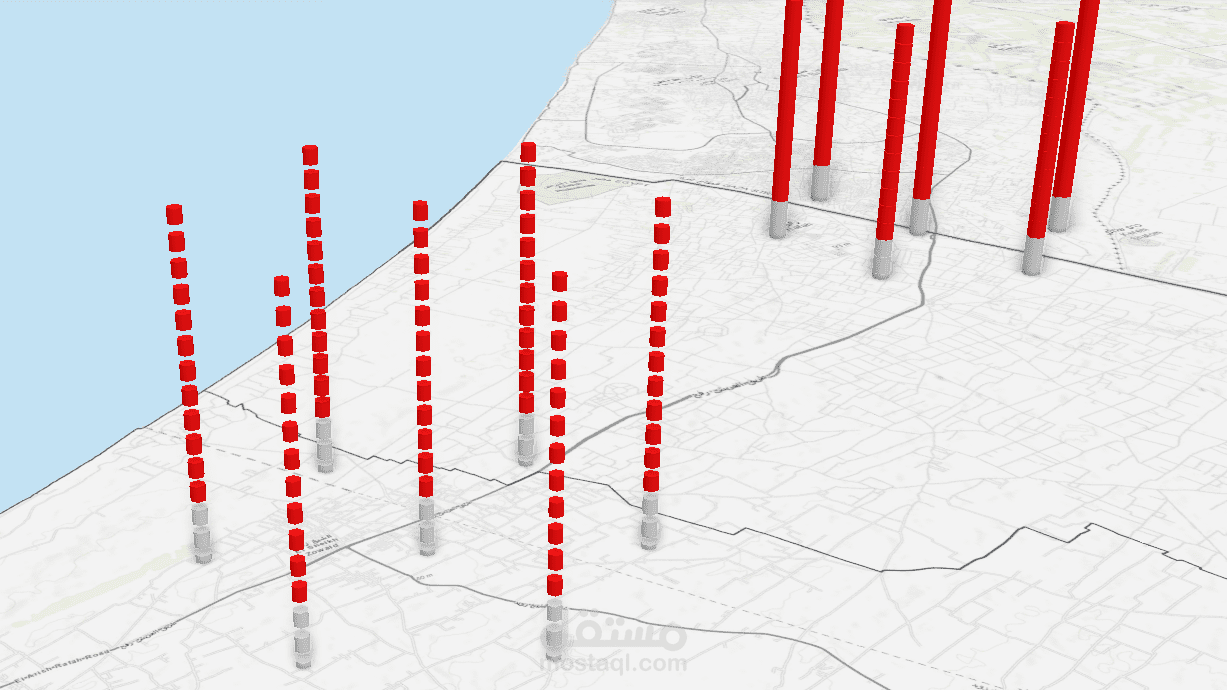
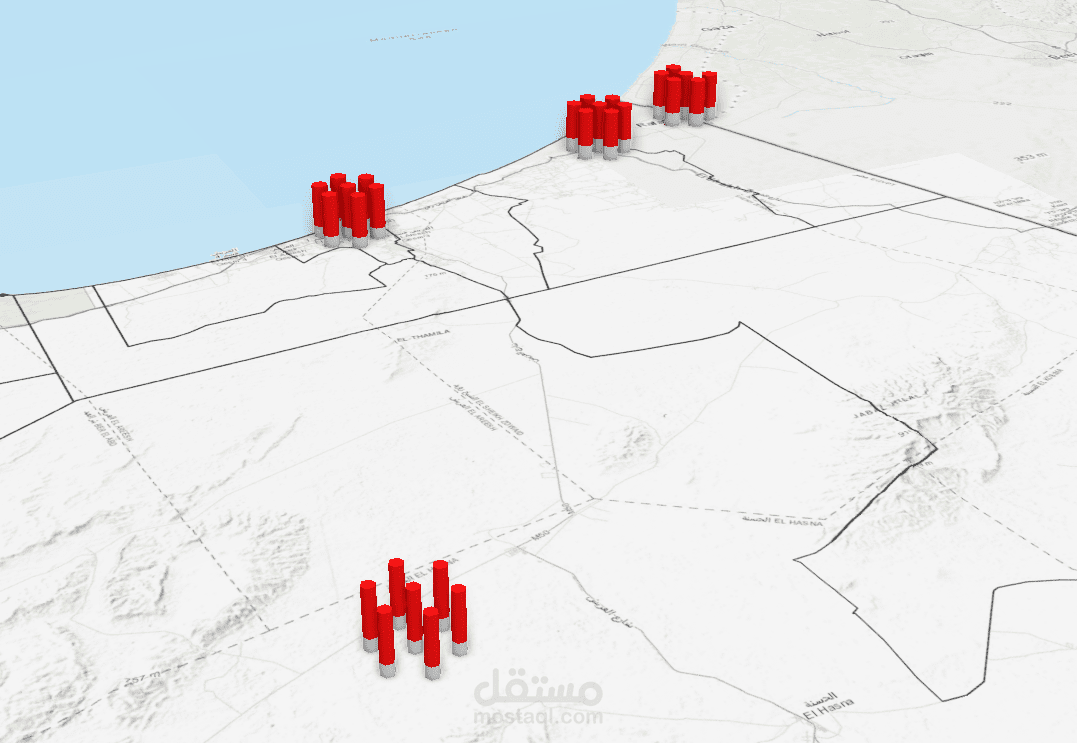
For the spatio-temporal analysis, terrorist attack data were organized into a space–time cube in NetCDF format, consisting of bins with X (longitude), Y (latitude), and T (time) dimensions. The cube was created with 25 × 25 km spatial dimensions and a one-year temporal dimension. This cube served as input for the Emerged Hotspot Analysis using the Ord & Getis formula.