Pizza Sales Dashboard
تفاصيل العمل

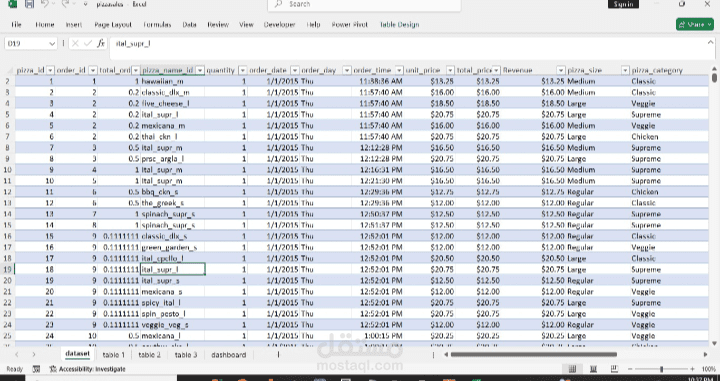

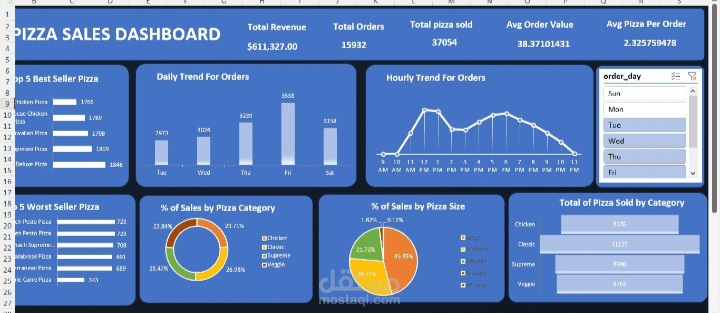
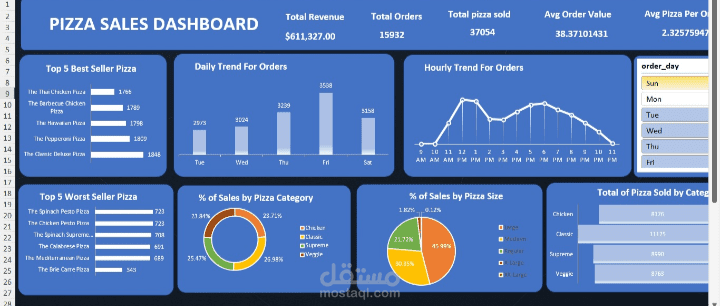
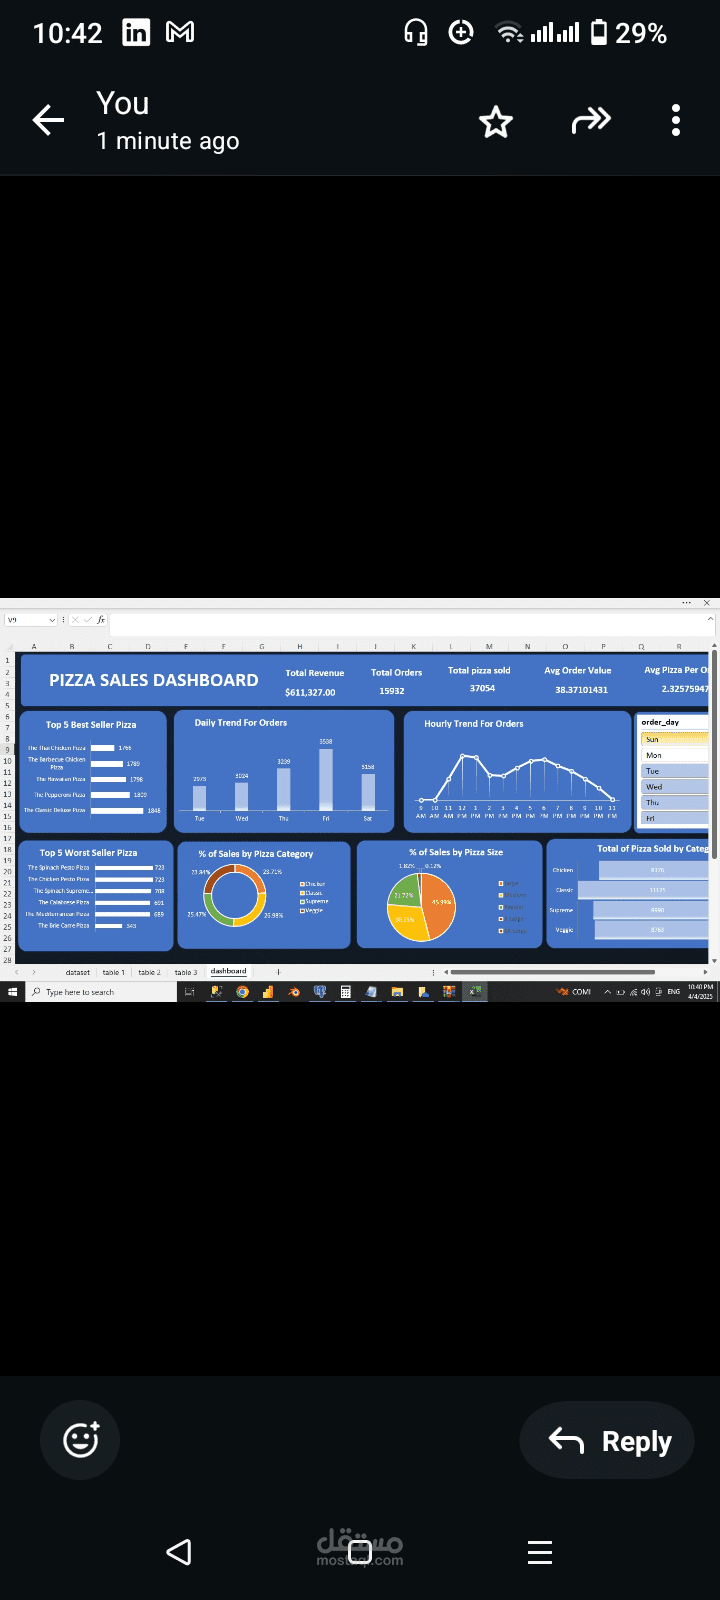
### **Pizza Sales Dashboard – Data Analytics Project**
This interactive **Pizza Sales Dashboard** provides a comprehensive overview of key business metrics, leveraging **Excel and Data Visualization** techniques to analyze sales performance.
### **Key Insights & Metrics:**
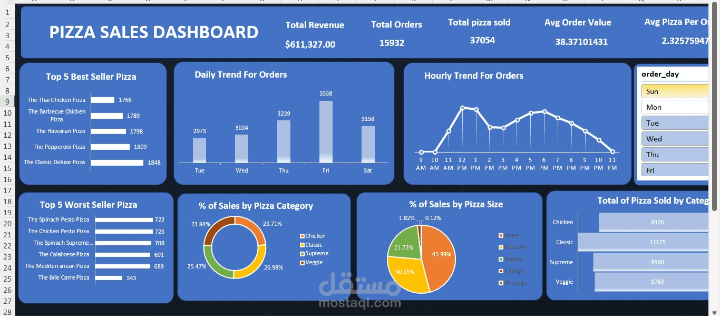
**Total Revenue:** $611,327.00 – Displays overall earnings.
**Total Orders:** 15,932 – Measures customer transaction volume.
**Total Pizzas Sold:** 37,054 – Highlights demand for products.
**Average Order Value (AOV):** 38.37 – Calculates the average revenue per order.
️ **Average Pizzas Per Order:** 2.32 – Tracks customer purchasing behavior.
### **Performance Analysis:**
**Top 5 Best-Selling Pizzas** – Identifies the most popular pizza varieties.
**Top 5 Worst-Selling Pizzas** – Recognizes underperforming menu items.
**Daily & Hourly Trends for Orders** – Helps in optimizing staffing and marketing strategies.
**Sales Distribution by Category & Size** – Guides inventory and menu decisions.
### **Business Impact & Applications:**
**Data-Driven Decision Making** – Helps businesses optimize pricing, promotions, and inventory.
**Sales Trend Analysis** – Assists in peak-hour planning and demand forecasting.
**Product Performance Tracking** – Enables menu adjustments based on sales insights.
This dashboard serves as a powerful **business intelligence tool**, enabling restaurant owners and managers to make **informed, strategic decisions** to enhance profitability and operational efficiency.