Marketing Performance
تفاصيل العمل

Marketing Campaign Performance Analysis Using Data
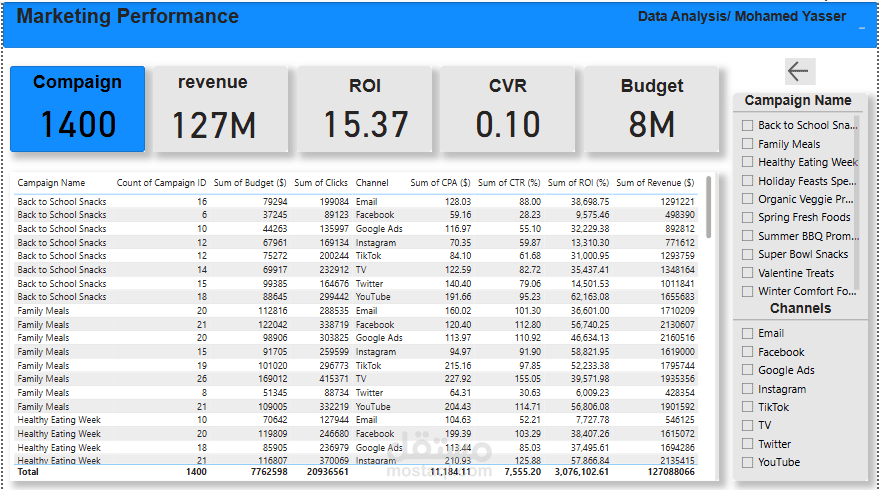
In the digital marketing world, data-driven decision-making is the key to maximizing ROI and optimizing campaign performance. That’s why I designed an interactive dashboard to analyze the performance of 1,400 marketing campaigns across multiple channels, including:
Email – Facebook – Google Ads – TikTok – TV – Twitter – ▶️ YouTube
Key Insights from the Analysis:
Total Campaigns: 1,400
Total Revenue: $127M
Return on Investment (ROI 24): 15.37
Conversion Rate (CVR 24): 0.10
Total Budget Spent: $8M
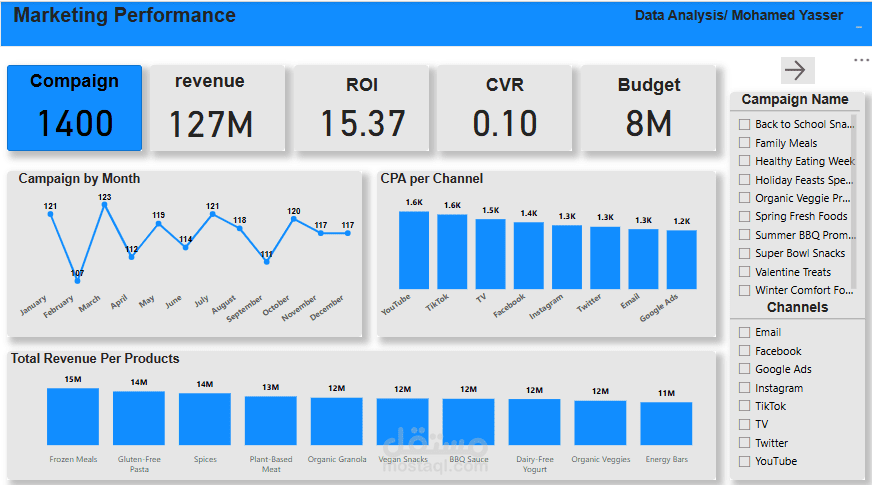
Dashboard Features & Analysis:
Campaign Trends Over Time – Identifies peak months like March (123 campaigns) and July (121 campaigns)
CPA by Channel:
YouTube & TikTok have the highest CPA at $1.6K
Google Ads has the lowest CPA at $1.2K
Total Revenue by Product:
Frozen Meals – $15M
Gluten-Free Pasta – $14M
Organic Granola – $12M
Why This Data Matters?
These insights help businesses identify the most cost-effective channels and optimize budget allocation for maximum ROI.
What do you think about these insights? Which marketing channel do you find the most effective in your campaigns? ? Drop your thoughts in the comments!
#MarketingAnalytics #DataDriven #PowerBI #BusinessIntelligence #MarketingPerformance