Exploring Weather Trends
تفاصيل العمل
Summary
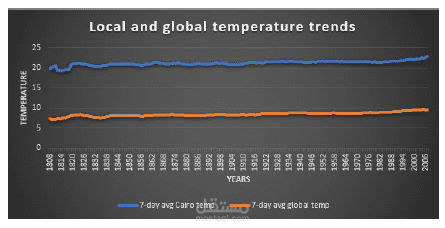
In this project, I analyzed local and global temperature data and compare the temperature trends for the closest city from where I live which is 'Cairo' to overall global temperature trends.
The city I live in did not exist in the data so I used the closest city to my country.
The goal is to create a visualization and prepare a write-up describing the similarities and differences between global temperature trends and temperature trends in the closest big city to where I live.
INTRODUCTION:
SQL Query was used to download (CSV) file that contains the yearly average temperature of the City ‘Cairo’ and the global temperature.
Then the data has been analyzed using Python Programming Language using IPython Notebook (Jupyter).
Progress outline:
Extract the data :
• Downloading 1 data file from SQL database as CSV.
Create a line chart:
• Calculating the Moving Average (Rolling Average) to make it easier to observe the trends when it is shown in Charts.
• Visualizing the Data Using matplotlib
Make observations:
• I made observations I saw related to the data "you can find more details on the Report file"
• I made a conclusion about the data.
more details have existed in the Report file.