Adidas Sales Performance Dashboard
تفاصيل العمل
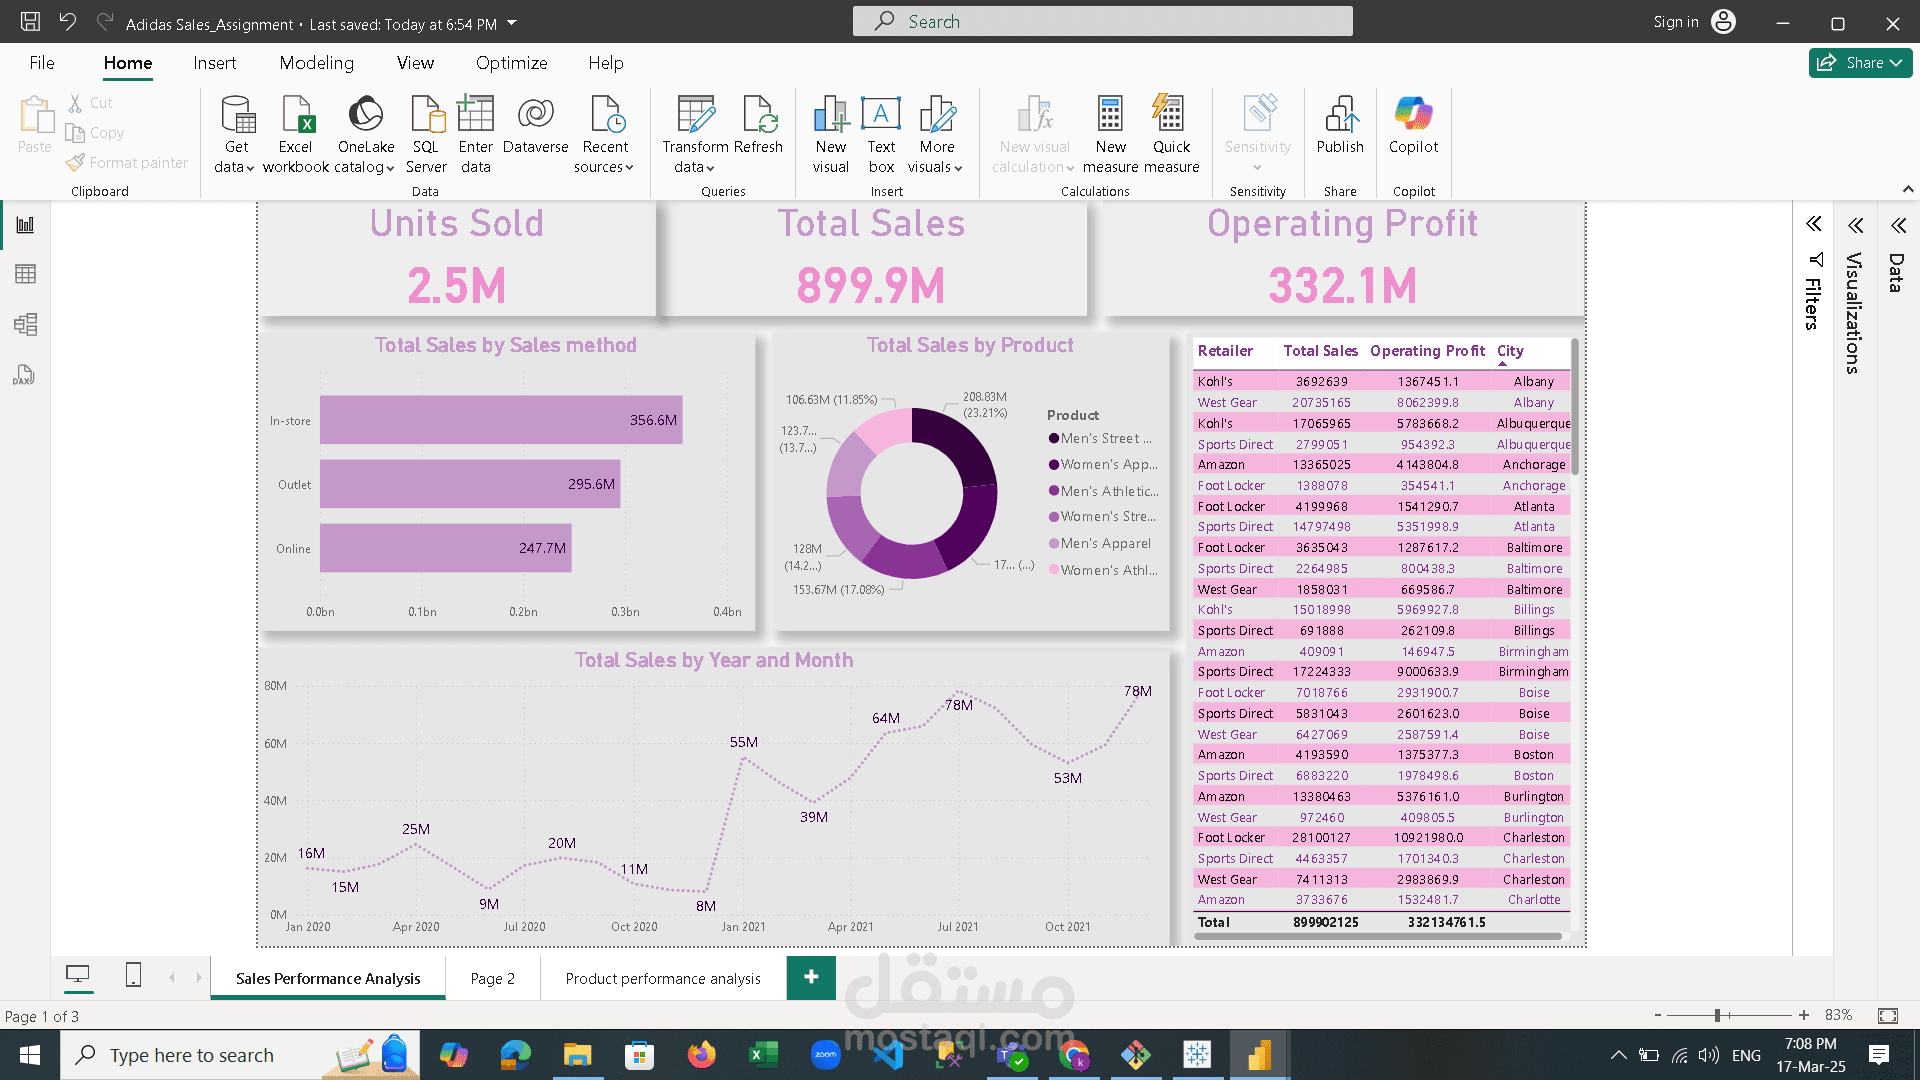
The Adidas Sales Performance Dashboard is an interactive Power BI report designed to analyze key sales metrics and operational performance across different sales channels and product categories.
Key Features:
Sales Overview: Tracks total sales (899.9M), units sold (2.5M), and operating profit (332.1M) to provide a high-level financial summary.
Sales Breakdown: Analyzes sales by sales method (In-store, Outlet, Online) and product category to identify the most profitable segments.
Retailer & Location Insights: Displays sales and profit data by retailer and city, helping to pinpoint high-performing regions and potential areas for improvement.
Time-Based Analysis: Tracks sales trends over time (monthly and yearly) to uncover seasonal patterns and revenue fluctuations.
Advanced Data Visualization: Utilizes bar charts, pie charts, and line graphs for intuitive data interpretation and strategic decision-making.
Business Impact:
Helps optimize sales strategies by identifying top-performing products and locations.
Supports inventory and pricing decisions based on sales trends and profitability.
️ Enhances marketing and sales efforts by focusing on high-revenue sales channels.