Costa Coffee Dashboard
تفاصيل العمل
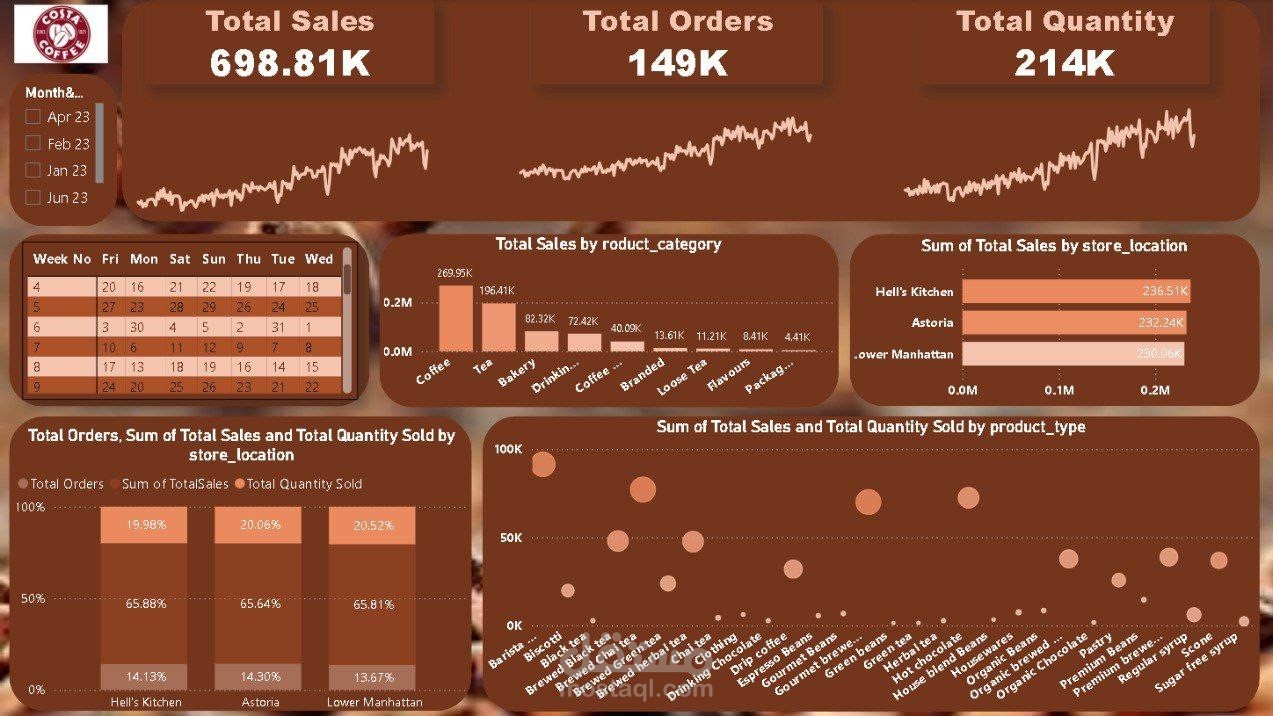
The Costa Coffee Sales Dashboard is an interactive Power BI report designed to analyze and visualize sales performance across multiple store locations.
Key Features:
Comprehensive Sales Overview: Analyzes 698K+ total sales, 149K orders, and 214K quantities sold.
Dynamic Performance Insights: Tracks sales trends by product category, store location, and time period using DAX measures.
Advanced Data Visualization: Implements interactive charts, KPIs, and filters to identify peak sales periods and best-selling products.
Business Impact: Provides actionable insights to improve sales strategies, optimize inventory management, and enhance store performance.