Netflix Movies Analytics Dashboard – Power BI
تفاصيل العمل
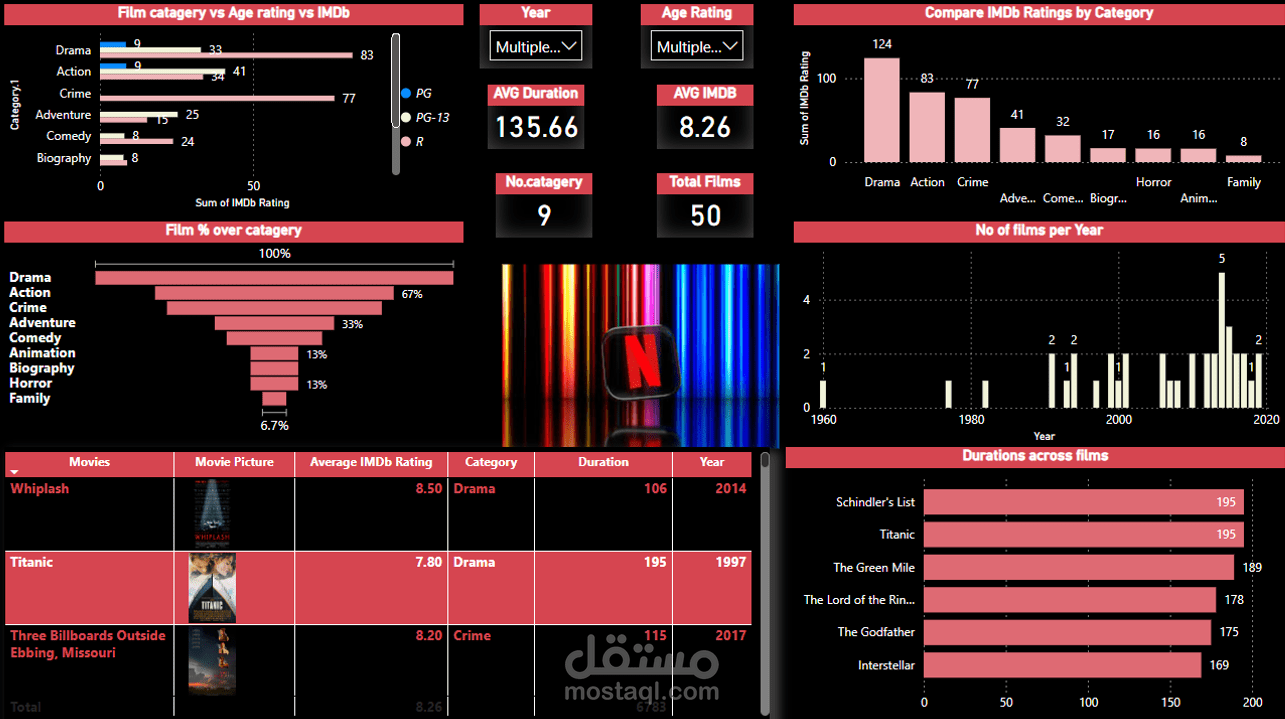
This Power BI dashboard provides a detailed analysis of Netflix movie data, offering insights into film categories, IMDb ratings, age classifications, and release trends. Designed for content analysts, media executives, and streaming platforms, this dashboard enables data-driven decision-making by visualizing key performance indicators and trends in Netflix's movie catalog.
Key Features:
Comprehensive Movie Performance KPIs – Includes average IMDb rating, average duration, total films, and category distribution.
Genre-Based Analysis – Breakdown of film categories by IMDb ratings, age ratings, and overall percentage share.
IMDb Ratings vs. Category Comparison – Identifies top-performing genres based on IMDb scores.
Film Release Trends Over Time – Visual representation of number of films released per year.
Duration Insights – Comparison of movie runtimes across popular films.
Dynamic Filtering & Interactivity – Filters by year, age rating, and category for customized analysis.
Movie Data Table with Posters – Displays top movies along with images, IMDb ratings, duration, and release year.
Ideal For:
Streaming platforms & media analysts – Understand content trends & audience preferences.
Film industry professionals – Identify successful genres and IMDb rating patterns.
Data analysts & business stakeholders – Gain valuable insights for content strategy & acquisitions.
Technology Stack:
Tool: Microsoft Power BI
Data Sources: Netflix movie datasets (CSV, Excel, SQL, or API)
Interactivity: Dynamic slicers, filters, and drill-through functionality
This Netflix movie analytics dashboard can be customized to suit specific business requirements. Contact me for tailored Power BI solutions!