Sales market Analysis Dashboard – Power BI
تفاصيل العمل

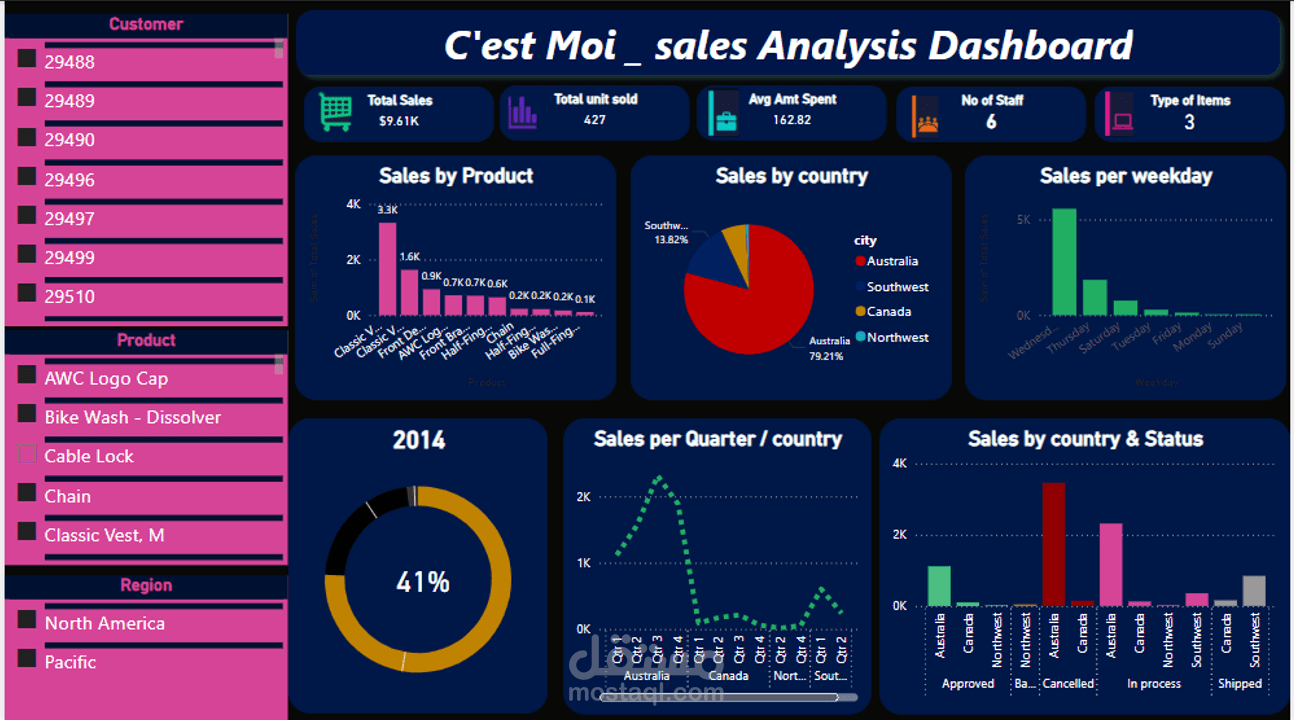
This Power BI Sales Analysis Dashboard provides a comprehensive overview of sales performance, including total revenue, units sold, customer segmentation, and geographical insights. Designed for business analysts, sales teams, and executives, this dashboard enables data-driven decision-making by visualizing sales trends, product performance, and regional breakdowns.
Key Features:
Sales Performance KPIs – Displays total sales, units sold, average amount spent, number of staff, and product variety.
Product Sales Analysis – Breakdown of sales by product category, helping businesses track top-performing items.
Geographical Insights – Sales distribution across countries and regions, presented with pie charts and bar graphs.
Sales Trends Over Time – Quarterly and yearly sales performance for forecasting and strategic planning.
Sales by Day of the Week – Identifies peak sales days to optimize marketing and operational efficiency.
Order Status Breakdown – Tracks order approvals, cancellations, and in-process sales, improving supply chain visibility.
Interactive Filters – Allows users to explore sales data by customer, product, and region for deeper insights.
Ideal For:
Sales teams & business analysts – Monitor key sales trends and performance metrics.
Retail & eCommerce businesses – Optimize inventory, track best-selling products, and analyze sales by region.
Decision-makers & executives – Gain real-time insights into sales performance and revenue trends.
Technology Stack:
Tool: Microsoft Power BI
Data Sources: Excel, SQL databases, cloud-based CRM integrations
Interactivity: Dynamic slicers, filters, and drill-through functionality
This Sales Analytics Dashboard is fully customizable to match your business needs. Contact me for tailored Power BI solutions!