interactive Car Sales Dashboard i
تفاصيل العمل

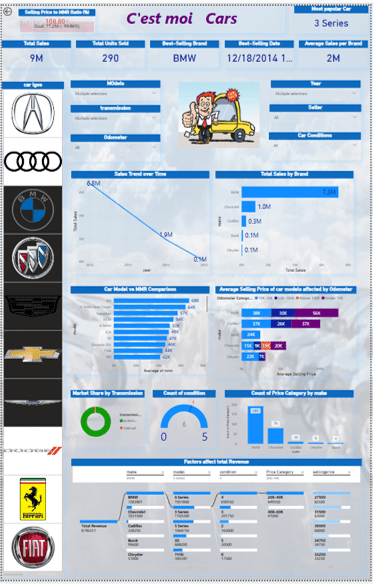
Interactive Car Sales Dashboard – Power BI
This dynamic Power BI dashboard provides a comprehensive analysis of car sales data, incorporating interactive elements, key performance indicators (KPIs), and advanced visualizations. Designed for dealerships, analysts, and business stakeholders, the dashboard enables data-driven decision-making by presenting sales trends, market share insights, and performance comparisons.
Key Features:
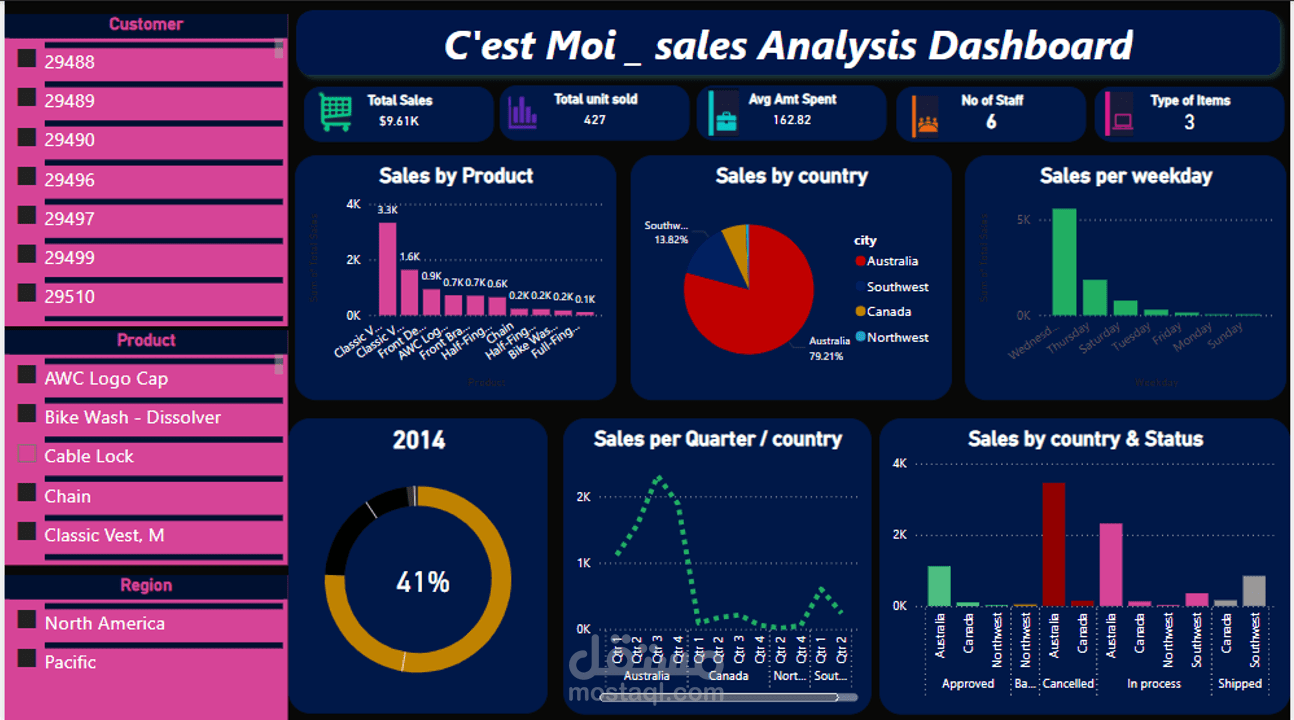
Sales Performance KPIs – Total units sold, best-selling brand, best-selling date, and average selling price.
Brand & Model Insights – Interactive filters allow users to explore sales by car brand, model, condition, and trim category.
Sales Trends Over Time – Time-series analysis showcasing historical sales trends and performance comparisons.
Price vs. Market Value (MMR) Comparison – Identifies pricing efficiency and profitability across different models.
Odometer vs. Selling Price Analysis – Provides insights into how mileage affects car pricing.
Market Share by Transmission Type – Visual breakdown of sales based on transmission preference.
Decomposition Tree & Influencing Factors – Advanced Power BI decomposition tree highlighting key factors driving total revenue.
Customizable & Interactive Filters – Users can interact with slicers, including brand logos, transmission types, and car conditions.
Ideal For:
Car dealerships & sales teams – Optimize inventory and pricing strategies.
Automotive analysts – Gain deep insights into market trends & pricing dynamics.
Business stakeholders – Make informed decisions based on real-time sales data.
Technology Stack:
Tool: Microsoft Power BI
Data Sources: Excel, SQL, API integrations (customizable)
Interactivity: Dynamic slicers, filters, drill-through pages