Titanic Dataset Analysis Dashboard
تفاصيل العمل
Project Description:
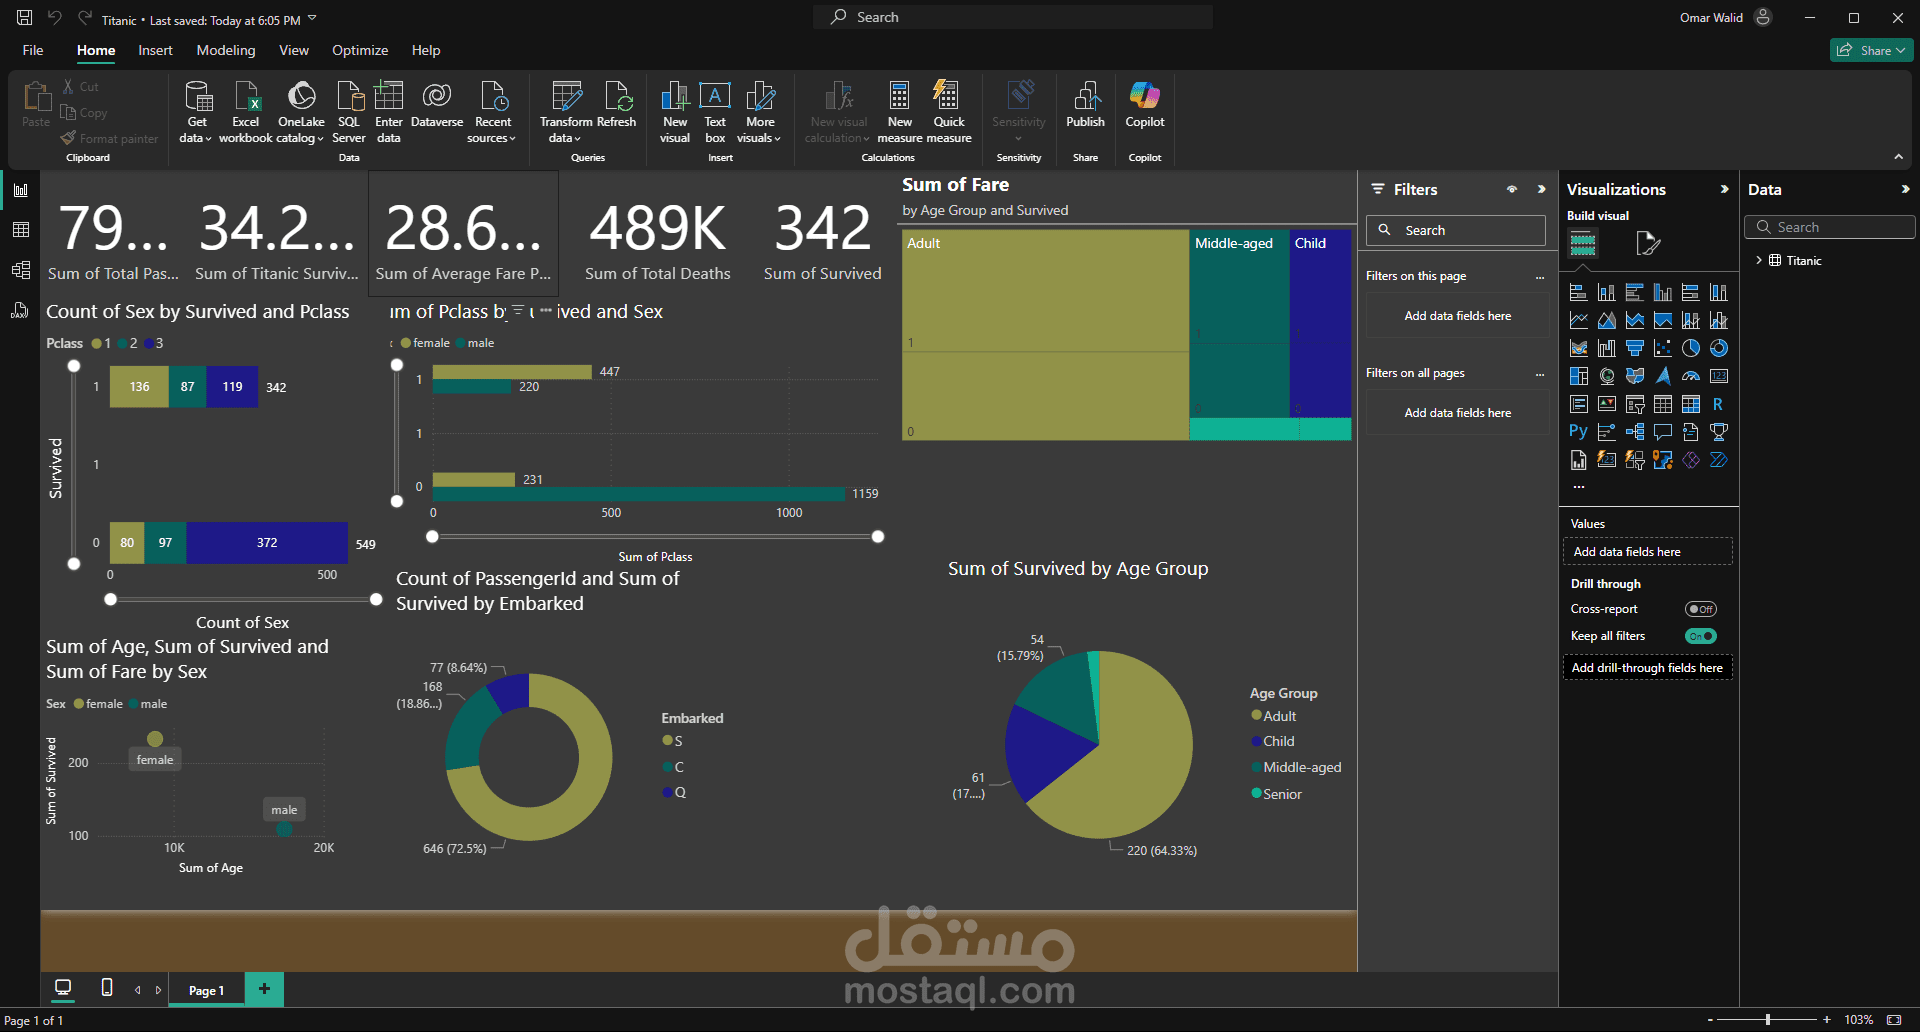
I will deliver a comprehensive Power BI dashboard analyzing the famous Titanic dataset. This interactive dashboard will provide detailed insights into passenger demographics, survival rates, and other key factors through advanced data visualization.
Key Features:
Interactive dashboard exploring Titanic passenger data.
Analysis of survival rates based on age, gender, and class.
Dynamic filtering for in-depth exploration.
Visual breakdown of passenger demographics.
Customizable visualizations to meet your specific needs.
Deliverables:
Power BI report file (.pbix) with interactive visuals.
Documentation for navigating and customizing the dashboard.
Support for future updates and modifications.
Ideal For:
Data analysts and researchers studying historical datasets.
Educators needing an interactive learning tool.
Data enthusiasts exploring survival analytics.
Businesses using data storytelling for insights.
Skills and Tools:
Microsoft Power BI
Data modeling and DAX calculations
Data visualization and analytics
Statistical and categorical analysis