SampleSuperstore Analysis by Power BI tool
تفاصيل العمل
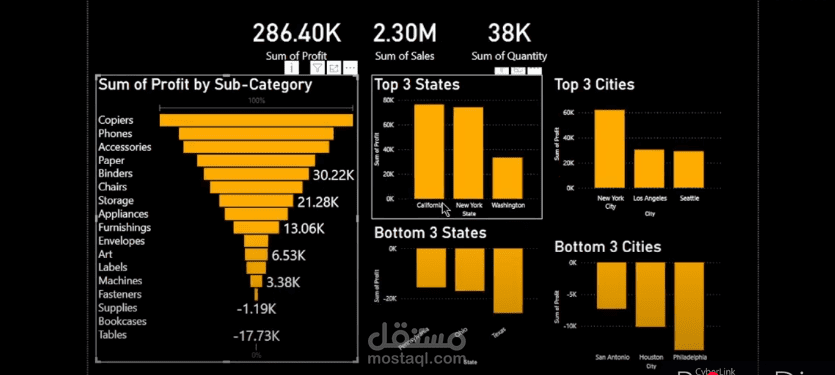
The Sample Superstore Analysis is a comprehensive business intelligence project aimed at analyzing sales performance, profitability, and customer trends using Power BI. The dataset contains transactional data from a retail store, including sales, profits, discounts, and customer segments across different regions and product categories.
Objectives
Gain insights into sales trends and profitability across different categories and regions.
Identify high-performing and underperforming products to optimize inventory management.
Analyze customer segments to enhance marketing and sales strategies.
Detect the impact of discounts on profitability to refine pricing strategies.
Develop interactive dashboards for data-driven decision-making.
Key Analyses and Insights
Sales & Revenue Analysis
Monthly and yearly sales trends.
Regional and category-wise revenue breakdown.
Profitability Analysis
Identification of the most and least profitable products.
Impact of discount strategies on profit margins.
Customer Segmentation
Analysis of customer demographics and purchasing patterns.
Sales contribution by customer segment.
Geographic Performance
Regional and state-wise sales and profit distribution.
Identification of high-performing and low-performing regions.
Product Performance
Best-selling and slow-moving products.
Correlation between discount rates and sales volume.
Tools & Technologies Used
Power BI for data visualization and dashboard creation.
DAX (Data Analysis Expressions) for custom calculations and measures.
Power Query for data transformation and cleaning.
Excel/CSV as the source dataset.
Outcome & Business Impact
Enhanced decision-making with dynamic dashboards.
Improved sales strategies by identifying profitable products and regions.
Optimized discount policies to maximize revenue without sacrificing profitability.
Better understanding of customer behavior to drive targeted marketing campaigns.