data analysis by python
تفاصيل العمل
Project Description:
This project involves analyzing and visualizing e-commerce customer behavior using Python. The dataset consists of two CSV files merged based on the 'Gender' column to create a comprehensive dataset for analysis.
Key Steps:
Data Merging:
Combined two datasets using an outer join to retain all relevant information.
Data Wrangling:
Explored the dataset structure, dimensions, and statistical summaries.
Identified missing values, incorrect data types, and duplicates.
Data Cleaning:
Converted date columns to appropriate formats.
Removed duplicates and negative values in numerical columns.
Handled missing values by filling numerical columns with mean/median and categorical columns with 'Unknown'.
Standardized text data by converting it to lowercase.
Exported the cleaned dataset to a new CSV file.
Data Visualization:
Used Seaborn and Matplotlib to generate insights through various visualizations:
Scatter Plots: Analyzed relationships between age, city, and items purchased.
Count Plots: Examined customer distribution by gender.
Histograms: Explored the distribution of sales, price, and items purchased.
Bar Plots: Investigated sales by membership type, device category, and country.
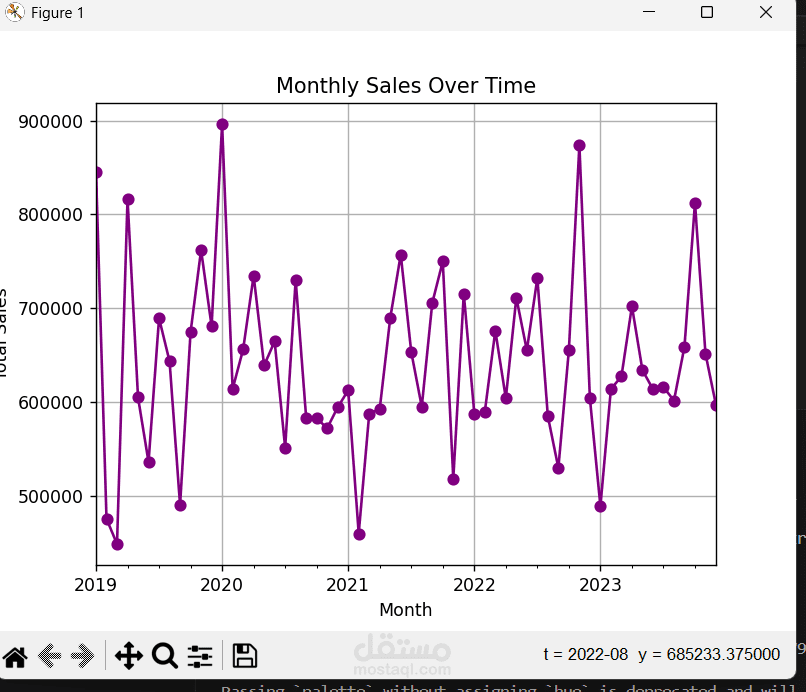
Time Series Analysis: Created a monthly sales trend visualization.
Pie Chart: Showed the proportion of different membership types.
Heatmap: Displayed the correlation between key numerical variables.
Box Plot: Compared sales distribution by product rating.
Skills Demonstrated:
Python for Data Analysis (Pandas, NumPy)
Data Cleaning & Preprocessing
Data Visualization (Matplotlib, Seaborn)
Exploratory Data Analysis (EDA)
Feature Engineering
Time Series Analysis
Outcome:
Successfully cleaned and visualized e-commerce customer data.
Identified insights on sales trends, customer behavior, and spending patterns.
Created an in-depth report that can help businesses make data-driven decisions.