financail dashboard
تفاصيل العمل
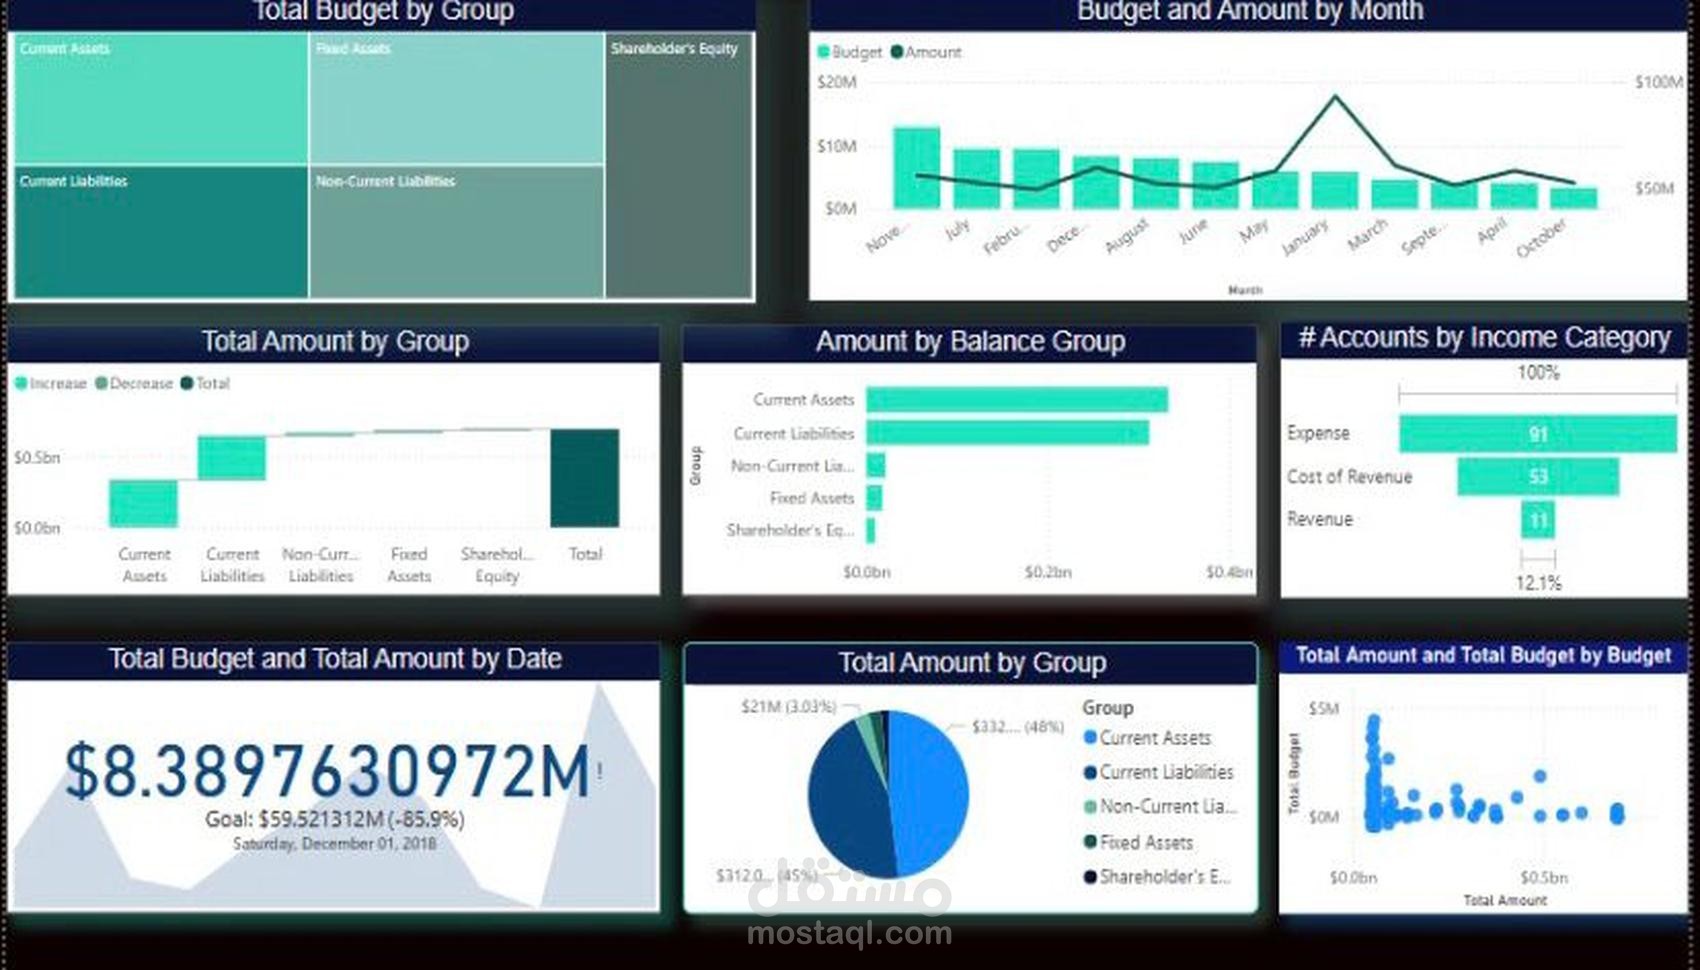
Total Budget by Group:
Displays the distribution of financial groups, including Current Assets, Fixed Assets, Shareholder’s Equity, Current Liabilities, and Non-Current Liabilities.
Uses a treemap chart to provide a visual representation of financial allocation.
Budget and Amount by Month:
Shows a comparative analysis of budget versus actual amount for each month.
Uses a combination of bar and line charts to highlight trends and deviations.
Total Amount by Group:
A bar chart displaying the total amount categorized by financial group.
Differentiates between increase and decrease in values to track financial growth.
Amount by Balance Group:
A horizontal bar chart illustrating amounts distributed across different financial groups.
Helps in understanding major contributors to financial standing.
# Accounts by Income Category:
A bar chart showing the number of accounts categorized by income classification.
Includes Expense, Cost of Revenue, and Revenue categories for financial assessment.
Total Budget and Total Amount by Date:
Displays key financial figures, including total budget and actual total amount achieved.
Highlights variance against financial goals.
Total Amount by Group (Pie Chart):
A pie chart representation of financial amounts distributed across major groups.
Provides a quick glance at budget proportioning.
Total Amount and Total Budget by Budget:
A scatter plot visualizing the relationship between total amount and total budget.
Identifies trends and outliers in budget allocation.
Interactivity and Filters:
Users can filter data based on Month, Entity, Group, and Income Category.
Enhances usability by allowing focused financial analysis based on specific parameters.
Key Financial Metrics:
155 Accounts: Total number of financial accounts analyzed.
4 Entities: Financial data is segmented across four entities.
102% Liquidity: Liquidity metric showcasing financial flexibility.
$96.86K Forecast: Forecasted financial performance.
$84M Total Budget: Allocated financial budget.
$693M Total Amount: Total actual financial figure achieved.
$342.95M Highest Category Amount: Highest financial allocation in a specific category.