financail dashboard
تفاصيل العمل
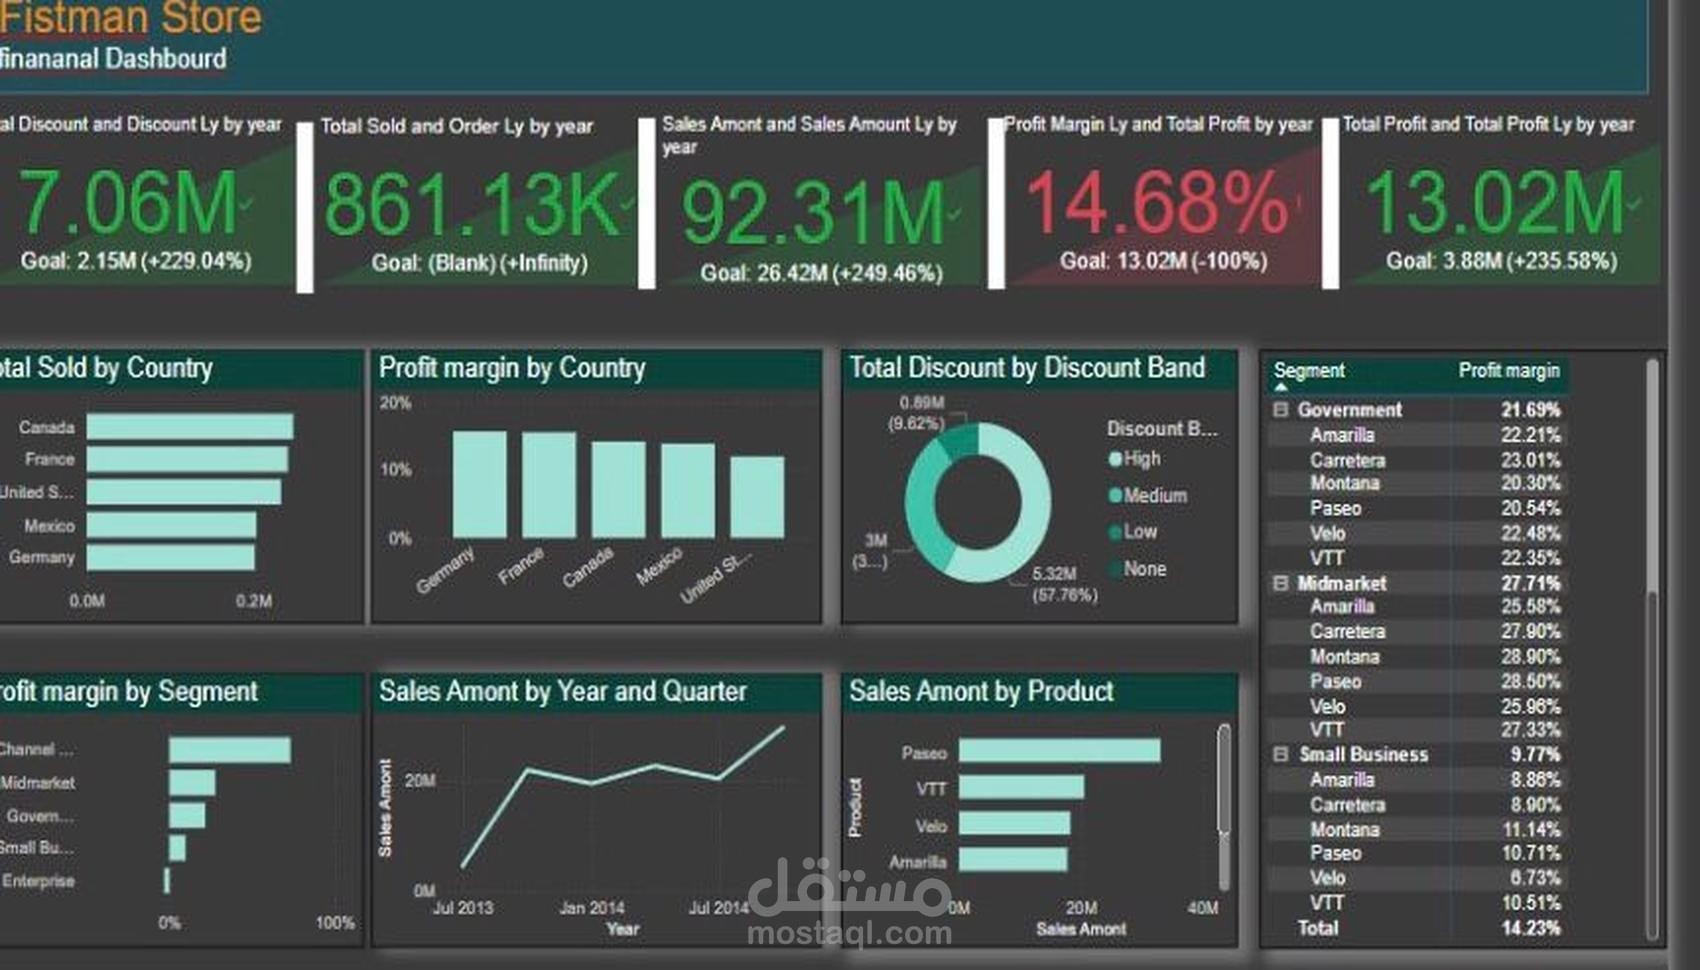
Key Components of the Dashboard:
Main KPIs (Key Performance Indicators):
Total Discount by Year: 7.06M (+229.04% compared to the goal).
Total Products Sold: 861.13K.
Total Sales by Year: 92.31M (+249.46% compared to the goal).
Profit Margin: 14.68% (compared to the goal of 13.02M).
Total Profit by Year: 13.02M (+235.58% compared to the goal).
Detailed Analytics:
Total Sales by Country: Canada and France lead in total sales.
Profit Margin by Country: Germany and France have the highest profit margins.
Total Discount by Discount Band: The most common discount category is Low Discounts (57.76%).
Profit Margin by Segment:
Government segment has a profit margin of 21.69%.
Midmarket segment has the highest margin at 27.17%.
Small Business segment has the lowest margin at 9.77%.
Sales Trend by Year and Quarter: Sales show a steady growth trend over time.
Sales by Product: The best-selling product is Paseo.
Additional Observations:
Dark-themed colors give a professional look while highlighting key data points.
Good use of visual elements like bar charts, line graphs, and pie charts, making the data easy to analyze and interpret.