Store Annual Report
تفاصيل العمل
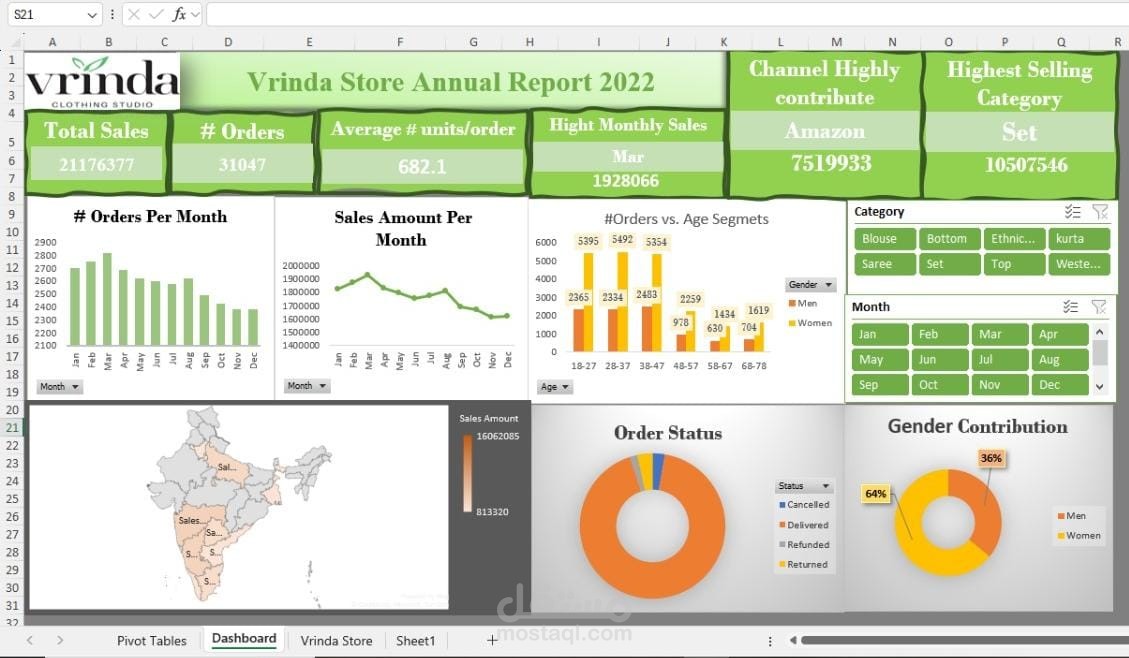
First, I load the Vrinda Dataset using Pandas and explore its structure with .info() and .describe(), while handling any missing values. Next, I clean the data by removing duplicates, converting data types, and filling missing values before visualizing patterns using Matplotlib and Seaborn. Then, I perform statistical analysis like correlation and group-wise aggregation to uncover insights.
ملحوظة : هذه البيانات موجوده أونلاين استخدمتها لتطبيق أدوات تحليل البيانات