Design marketing strategies
تفاصيل العمل

Throughout this project, I dive deeper into a large amount of data regarding the both riders, where the project goal is creating insights by designing marketing strategies aimed at converting casual riders into annual members, and I found the chance to apply the correct phases to accomplish the goal.
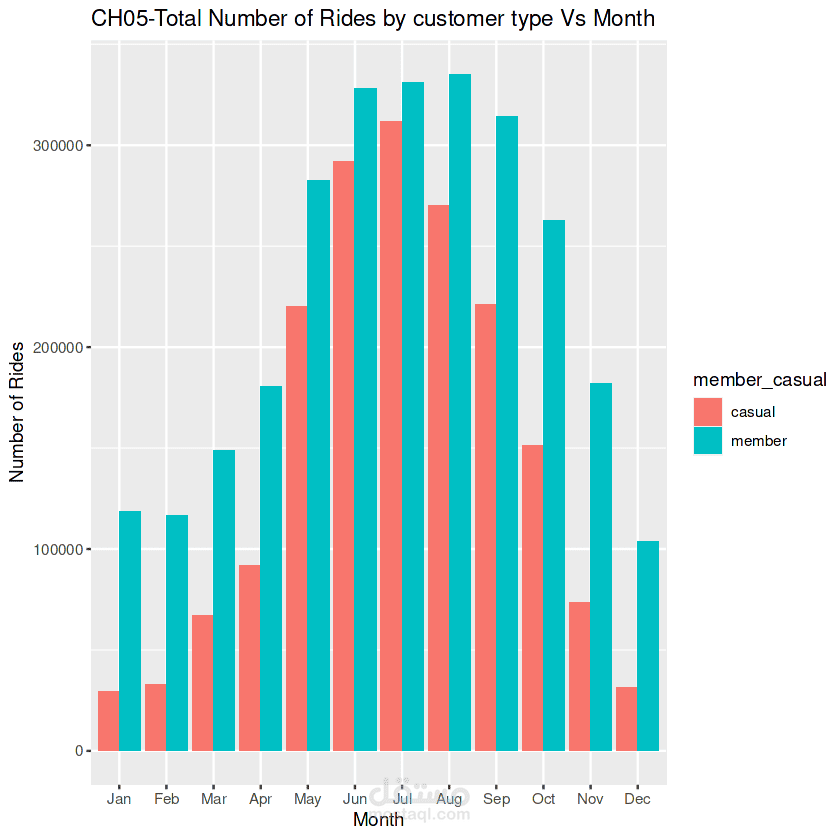
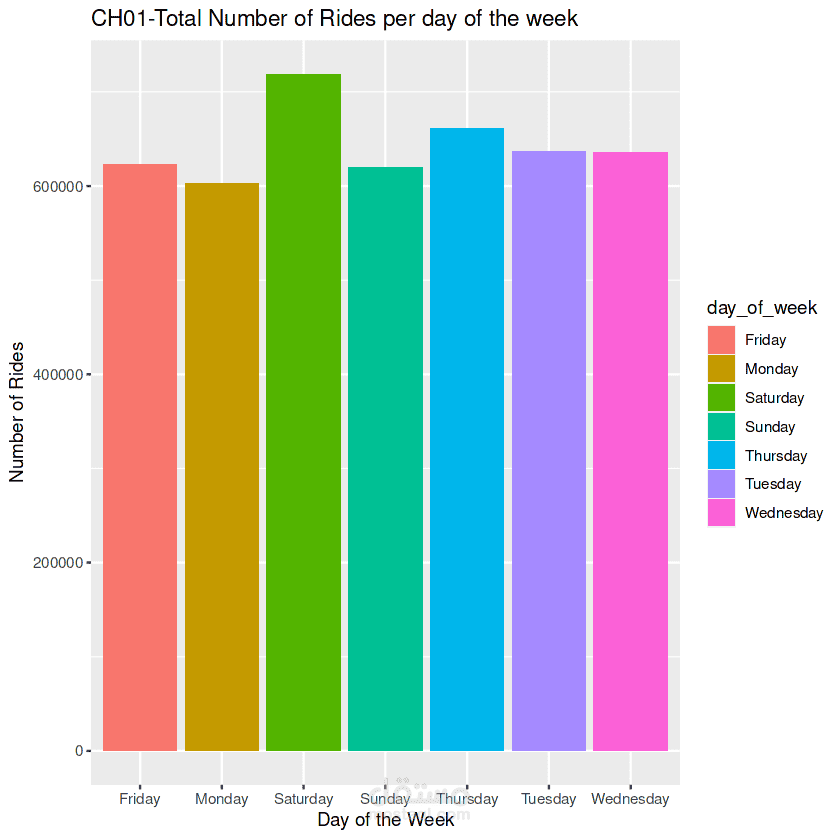
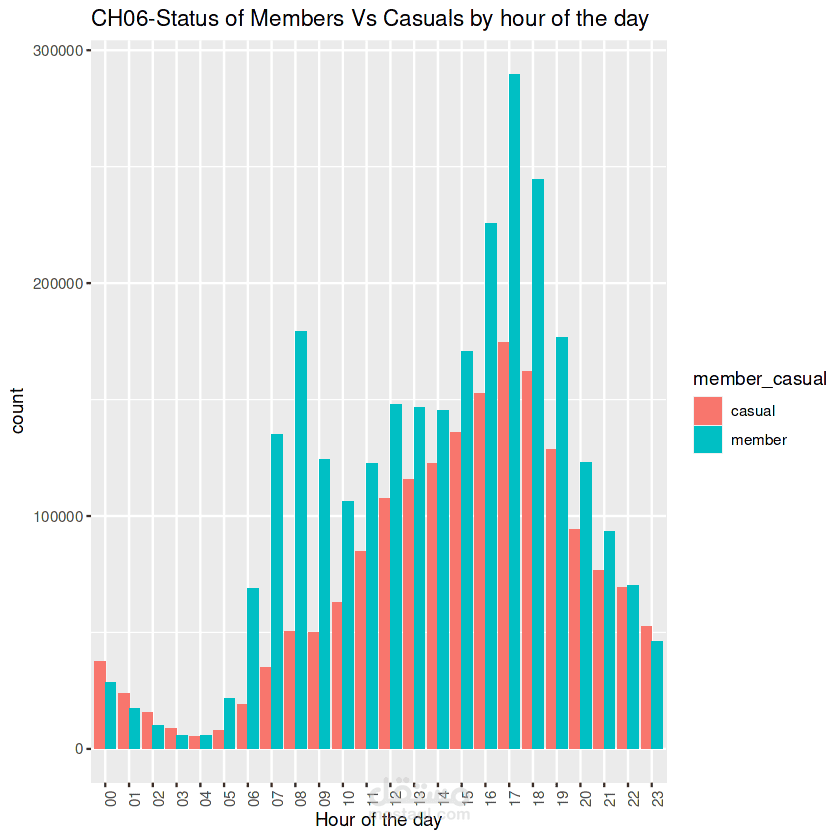
Data visualizations help in raising my key insights, which are:
1.Weekday Influence: A significant factor for the day of the week in the number of riders, especially casual riders, that can influence the throughput.
2.Day durations: casual riders travel more, especially in specific hours.