Chocolate Sales Insights using PowerBI
تفاصيل العمل
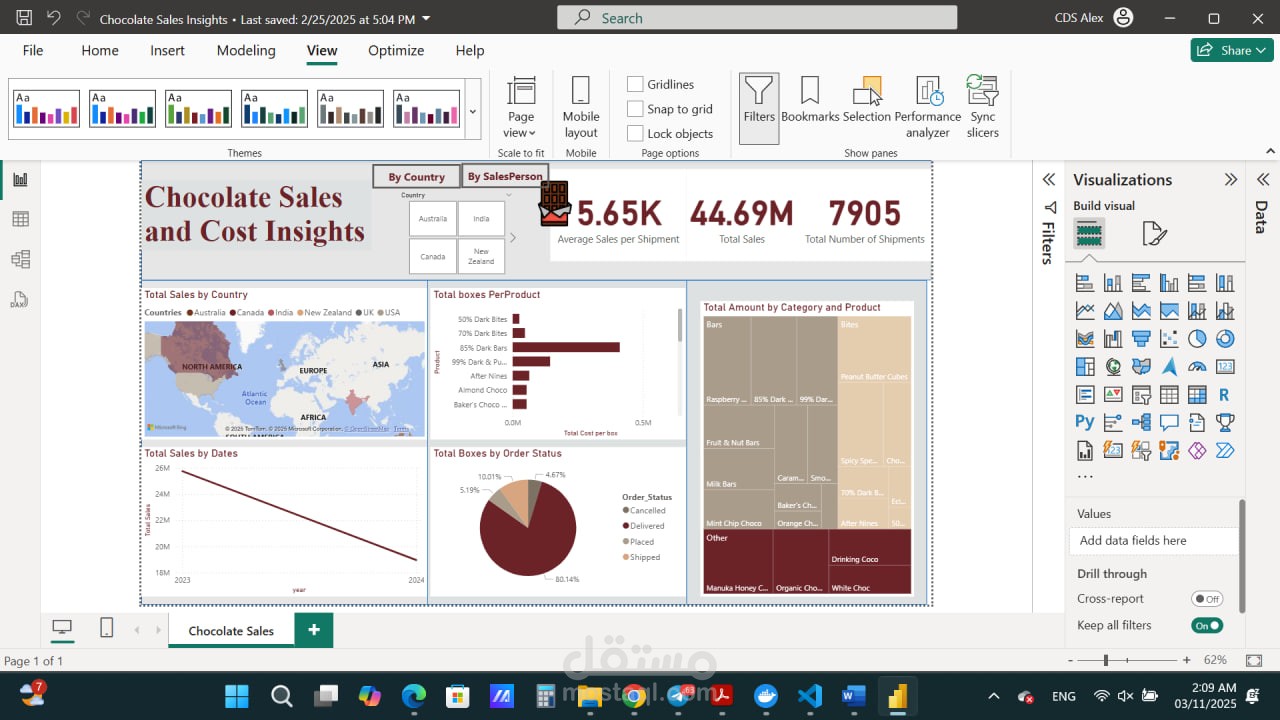
This is a choclate sales and cost insights using PowerBI. The Dataset is about a chocolate factory that has branches in several countries across different continents. The chocolates are sold in boxes and shipped . This dashboard shows the amount of boxes sold and shipped accross the different branches by country, total boxes sold by product, total amount of boxes by category and product represented by a heat map, total sales by dates throughout 2023 and 2024, and finally the order status represented by a pie chart to show the percentages of the products that are shipped, cancelled , and delivered.