Sales Analytics
تفاصيل العمل
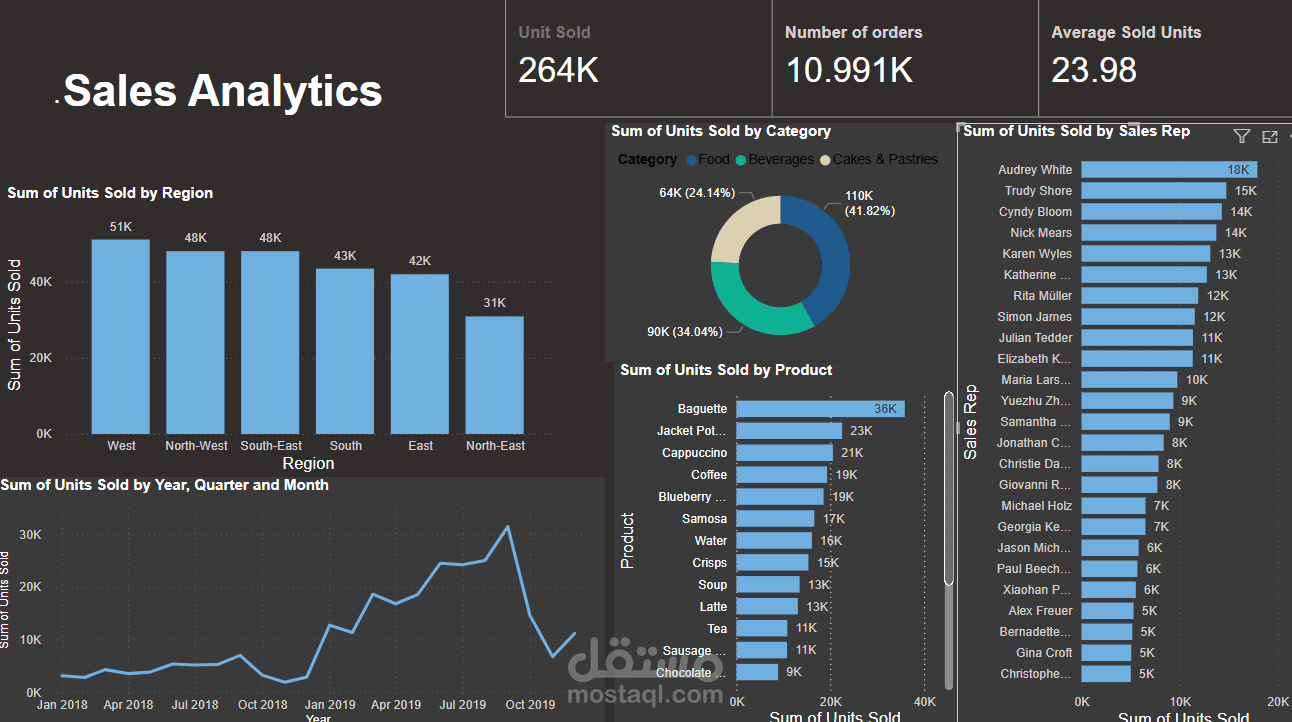
This dashboard provides a comprehensive overview of sales analytics, focusing on units sold, order volume, and sales performance across different categories, regions, sales representatives, and products. Here's a summary of the key insights:
Overall Sales Performance:
High Unit Sales: A total of 264,000 units were sold.
Significant Order Volume: The dashboard reports 10,991 orders, demonstrating a substantial volume of sales activity.
Consistent Average Sold Units: The average number of units sold per order is 23.98, suggesting a relatively consistent performance in order size.
Category Analysis:
Dominant Category: The "Sum of Units Sold by Category" doughnut chart shows "Beverages" as the dominant category, accounting for 41.82% (110,000 units) of total sales.
Significant Food Sales: "Food" represents a significant portion of sales at 24.14% (64,000 units).
Cakes & Pastries: The "Cakes & Pastries" category also contributes, though to a lesser extent.
Regional Performance:
Regional Sales Distribution: The "Sum of Units Sold by Region" bar chart shows the distribution of sales across different regions. The West, North-West, South-East, South, and East regions show relatively similar sales volumes, while the North-East region has the lowest sales.
Sales Representative Performance:
Top Performers: The "Sum of Units Sold by Sales Rep" bar chart highlights the top-performing sales representatives. Audrey White is the top performer with 16,000 units sold, followed by Trudy Shore, Cyndy Bloom, Nick Mears, and Karen Wyles.
Performance Variation: There is a notable variation in sales performance among the representatives, suggesting differences in effectiveness.
Product Performance:
Top Selling Products: The "Sum of Units Sold by Product" bar chart reveals the best-selling products. Baguette is the top seller, followed by Jacket Pot, Cappuccino, Coffee, and Blueberry.
Product Diversity: The chart also indicates a diverse range of products contributing to overall sales.
Time-Based Analysis:
Sales Trends Over Time: The "Sum of Units Sold by Year, Quarter and Month" line chart shows sales trends over time. There is a general upward trend in sales, with fluctuations across different months and quarters.
Seasonal Variations: The chart may indicate seasonal variations in sales, which can be further analyzed for strategic planning.
Key Takeaways:
Beverages are the most popular product category.
Sales performance varies significantly across regions and sales representatives.
Baguette is the top-selling product.
There is an overall upward trend in sales over time.
The dashboard provides valuable insights for sales managers to track performance, identify areas for improvement, and make data-driven decisions.