Product Sales Analysis
تفاصيل العمل
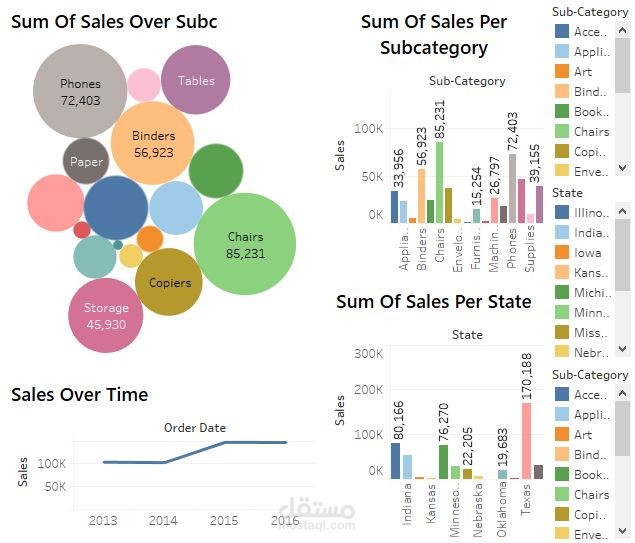
I created this interactive dashboard to analyze product sales across different subcategories, states, and time periods. The data visualizations highlight sales distribution by product category, performance across various states, and trends over the years. The goal of this analysis is to provide insights into top-performing product categories and sales growth trends in a visually intuitive way