revenu dashboard
تفاصيل العمل
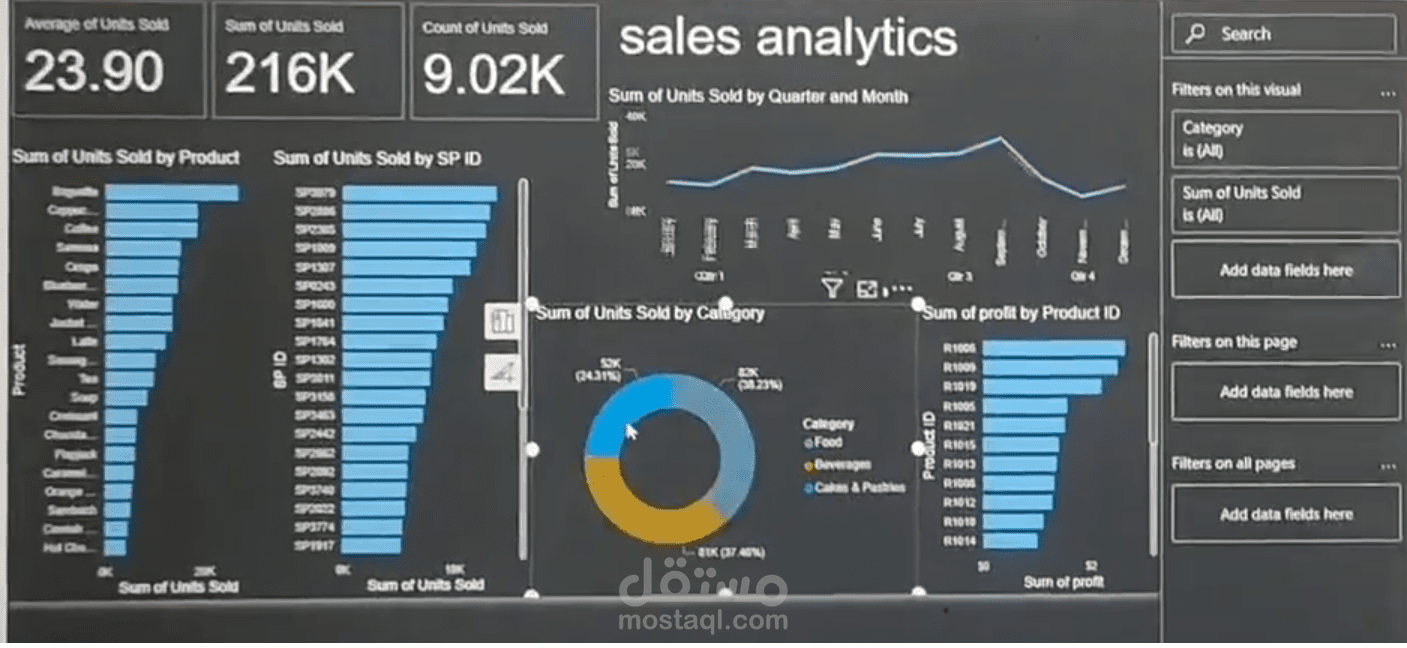
This Sales Analytics Dashboard provides an in-depth view of sales performance, focusing on units sold, product performance, and profitability. It enables businesses to track trends, identify best-selling products, and optimize sales strategies.
Key Metrics:
Average Units Sold per Transaction: 23.90
Total Units Sold: 216K
Total Transactions: 9.02K
Product & Sales Performance:
Top Products by Units Sold:
Baguette, Cappuccino, Coffee, Samosa, Crisps, and more.
Top Sales Representatives (SP ID) by Units Sold:
SP870, SP286, SP386, SP1000, SP107, and more.
Top Profitable Products:
R1006, R1095, R1019, R1005, R1021, and more.
Sales Trends & Distribution:
Quarterly and Monthly Sales Performance:
Steady growth with fluctuations in Q3 and Q4.
Category-Wise Sales Distribution:
Food: 24.31%
Beverages: 38.23%
Cakes & Pastries: 37.46%
Advanced Filtering & Insights:
Users can filter data by category, units sold, and product ID for deeper insights.
Interactive search options for customized data exploration.