Sales & Employee Performance Analysis Using Python & SQL
تفاصيل العمل
This project focuses on analyzing employee performance and sales data to extract meaningful insights that help businesses optimize workforce productivity and revenue generation.
Tools & Technologies Used:
Python (Pandas, Matplotlib, Seaborn) for data processing & visualization
SQL for querying and analyzing sales & employee records
Excel for data cleaning and preprocessing
Power BI for interactive dashboards
Key Insights & Achievements:
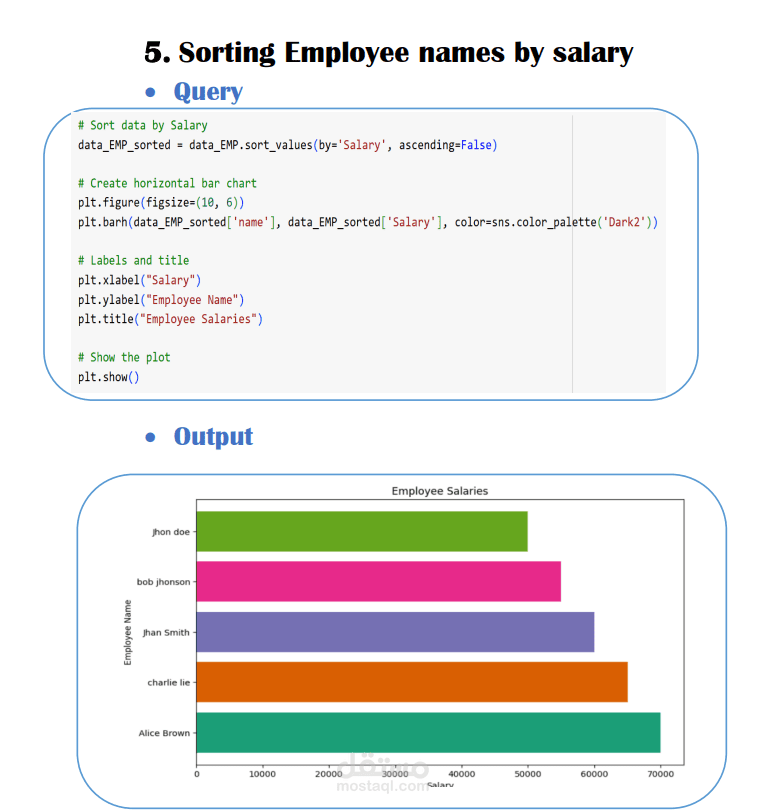
Identified top-performing employees based on sales data
Analyzed department salary distribution and workload efficiency
Evaluated customer purchases over $10,000 for high-value segmentation
Created interactive Power BI dashboards to visualize sales & performance trends