Python vs R: A Data Analysis Speed and Performance
تفاصيل العمل
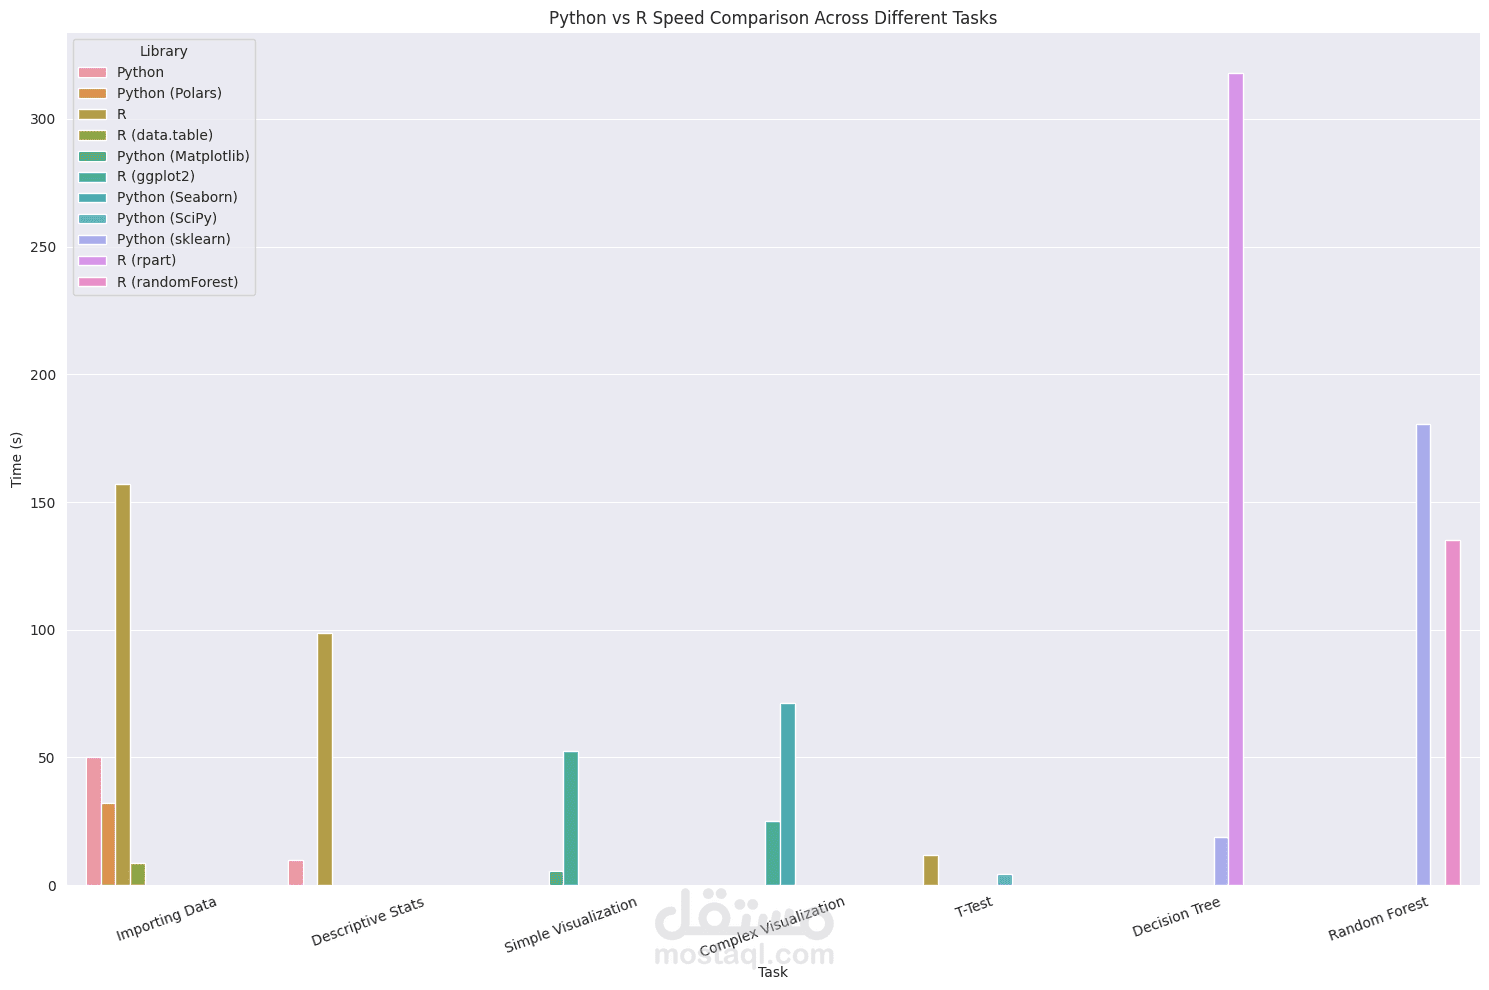
Over 10 million rows of data to compare Python and R performance across data analysis tasks, including descriptive statistics, decision trees, and random forests, a heatmap was generated to visualize traffic patterns.
Python Polars, Matplotlib, Seaborn, SciPy, Folium, scikit-learn, rpy2
R data.table, tidyverse, lubridate, rpart, randomForest, gridExtra