Central Superstore Dashboard
تفاصيل العمل
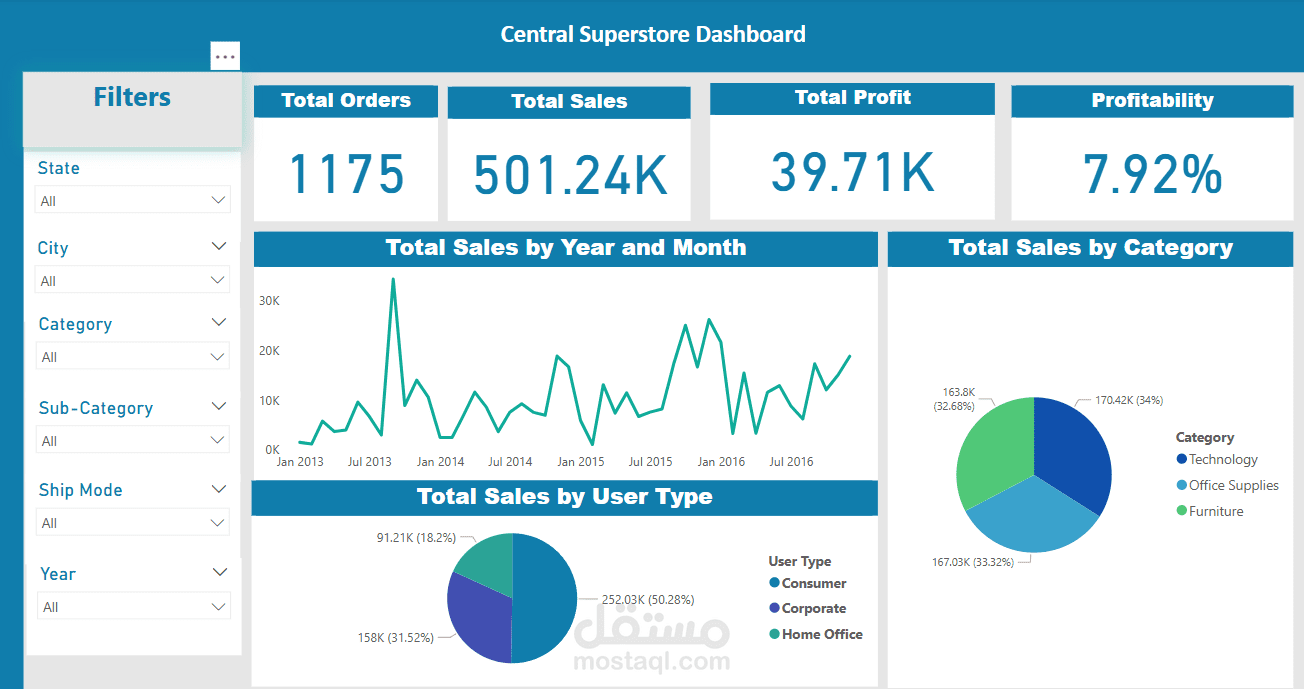
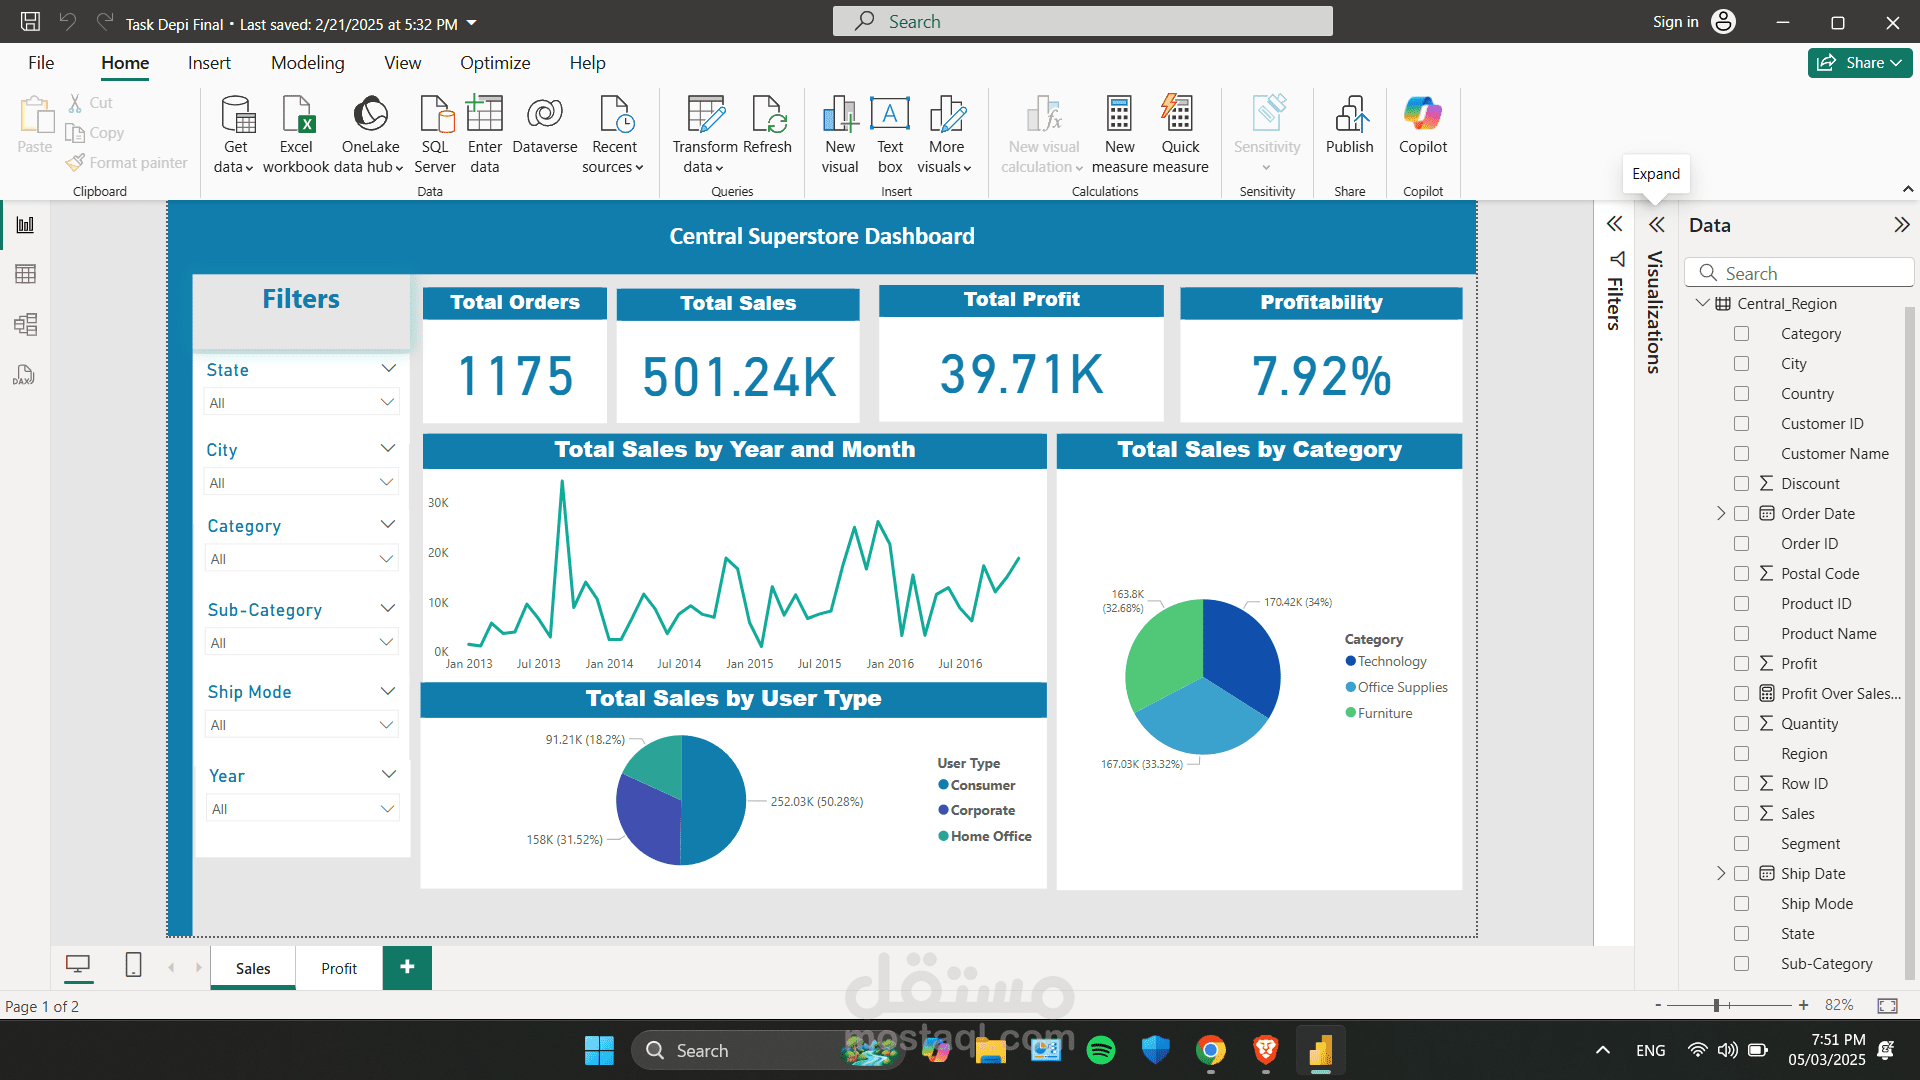
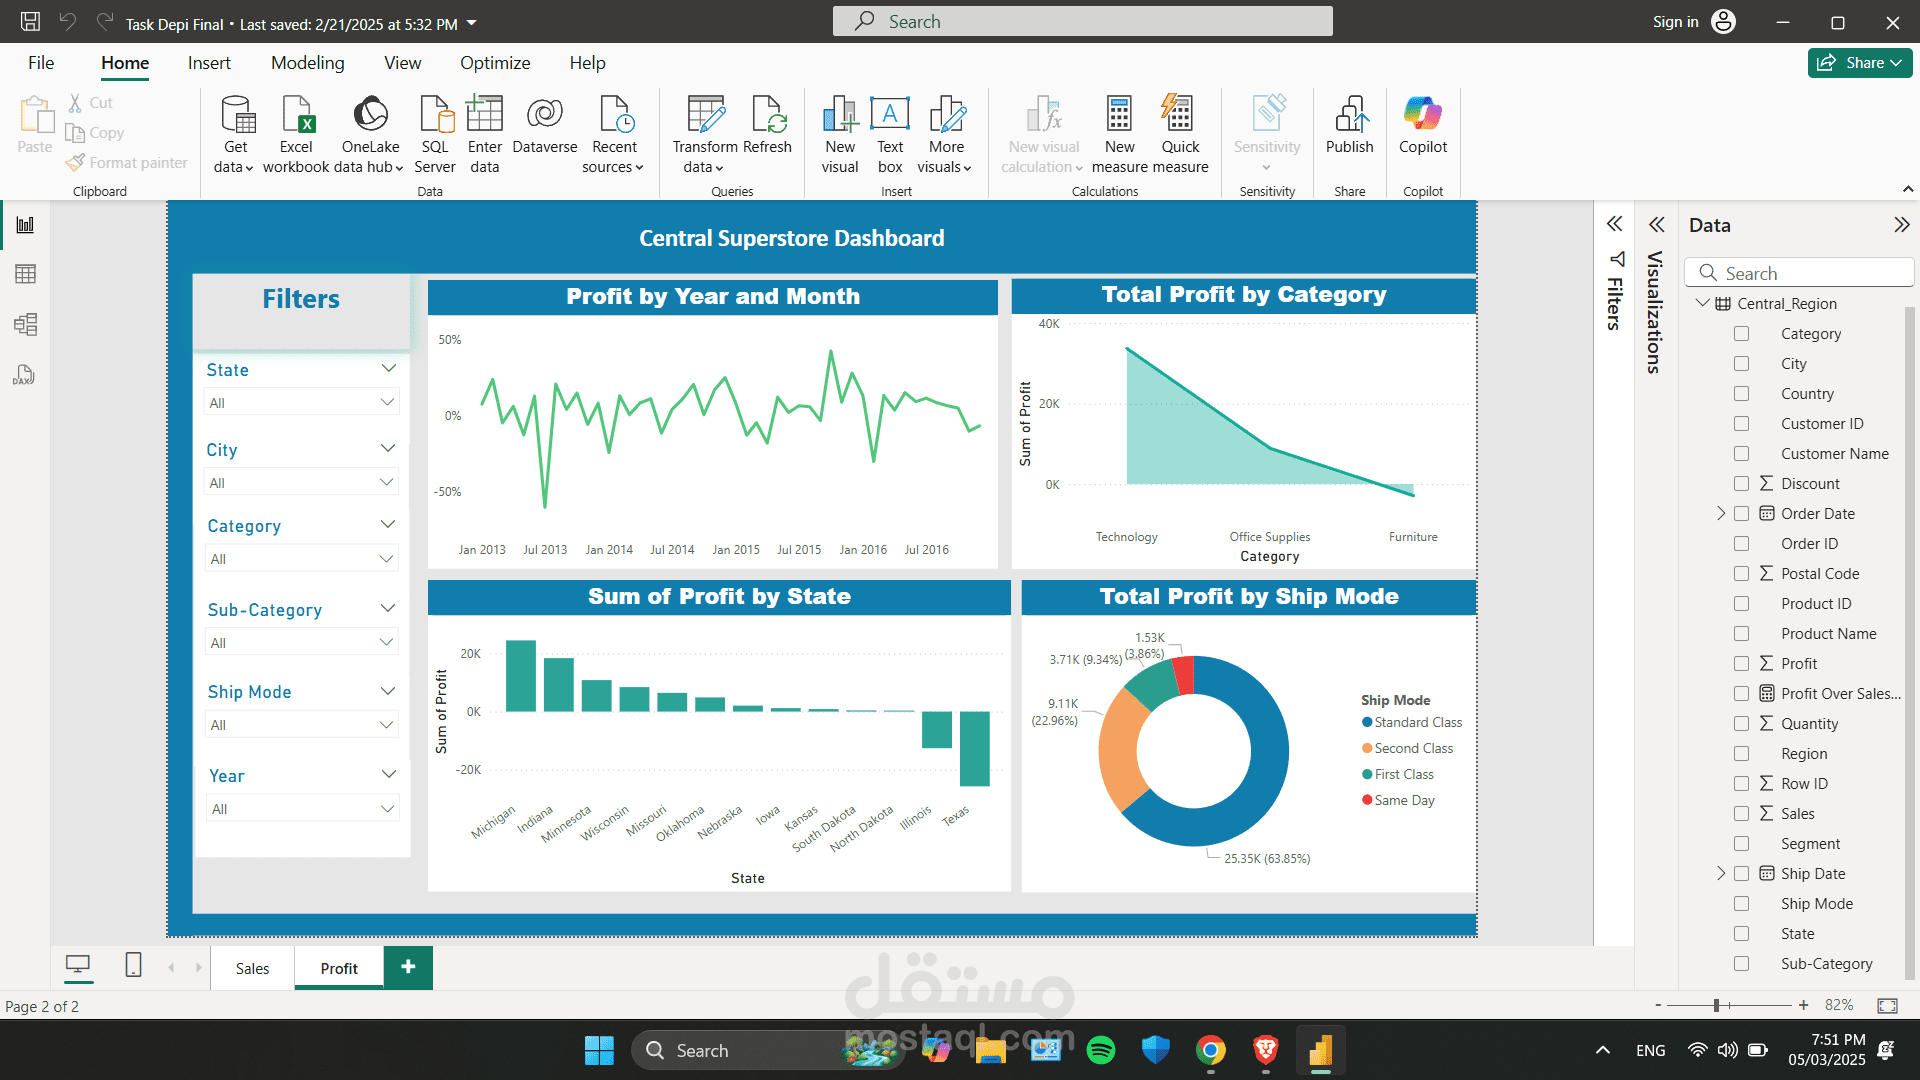
This Power BI dashboard provides a comprehensive overview of sales performance for the Central Superstore, helping businesses track and analyze key financial metrics.
Features:
Key Metrics Display – Highlights total orders, sales, profit, and profitability for quick insights.
Sales Trend Analysis – Tracks monthly and yearly sales trends to identify growth patterns.
Category Performance – Breaks down total sales by product category to highlight top-performing segments.
Customer Segmentation – Analyzes sales distribution by user type (Consumer, Corporate, Home Office).
Interactive Filters – Allows dynamic filtering by State, City, Category, Sub-Category, Ship Mode, and Year for a deeper data dive.
This dashboard is perfect for retail business intelligence, sales performance analysis, and strategic decision-making, enabling data-driven insights to optimize profitability.