Titanic Dashboard
تفاصيل العمل
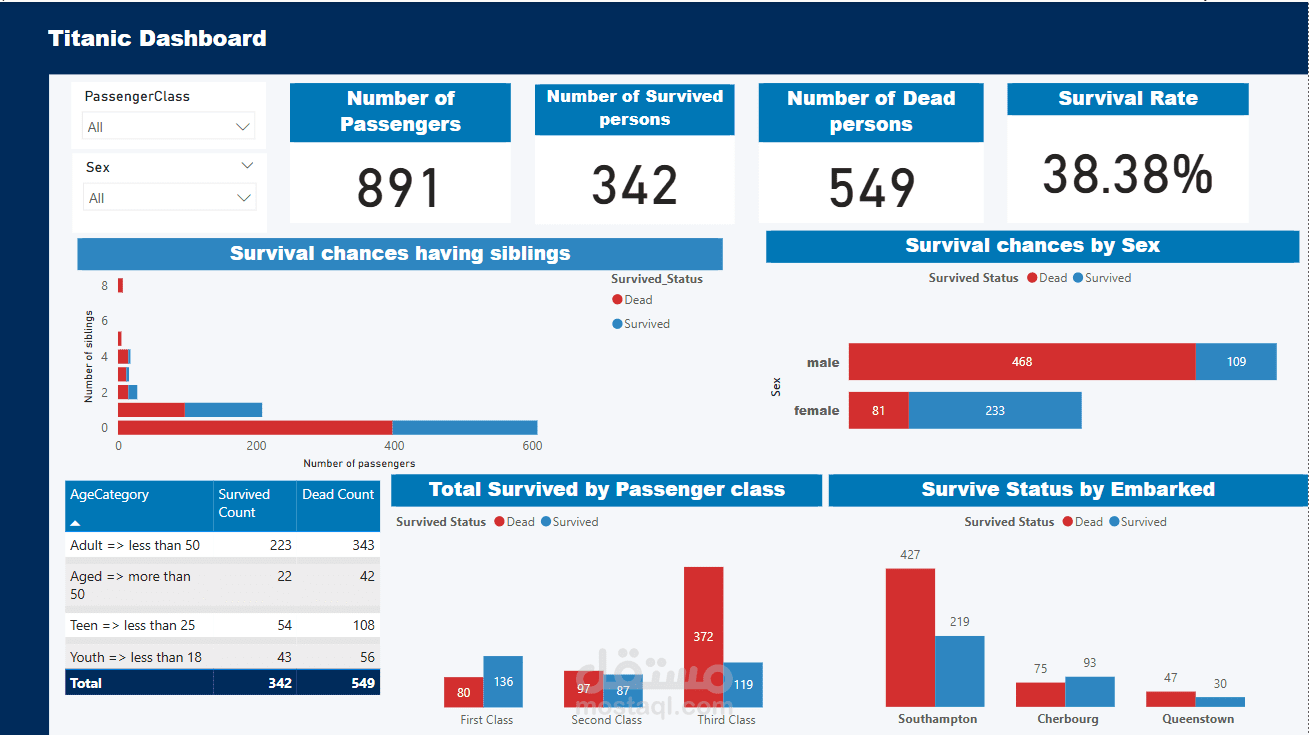
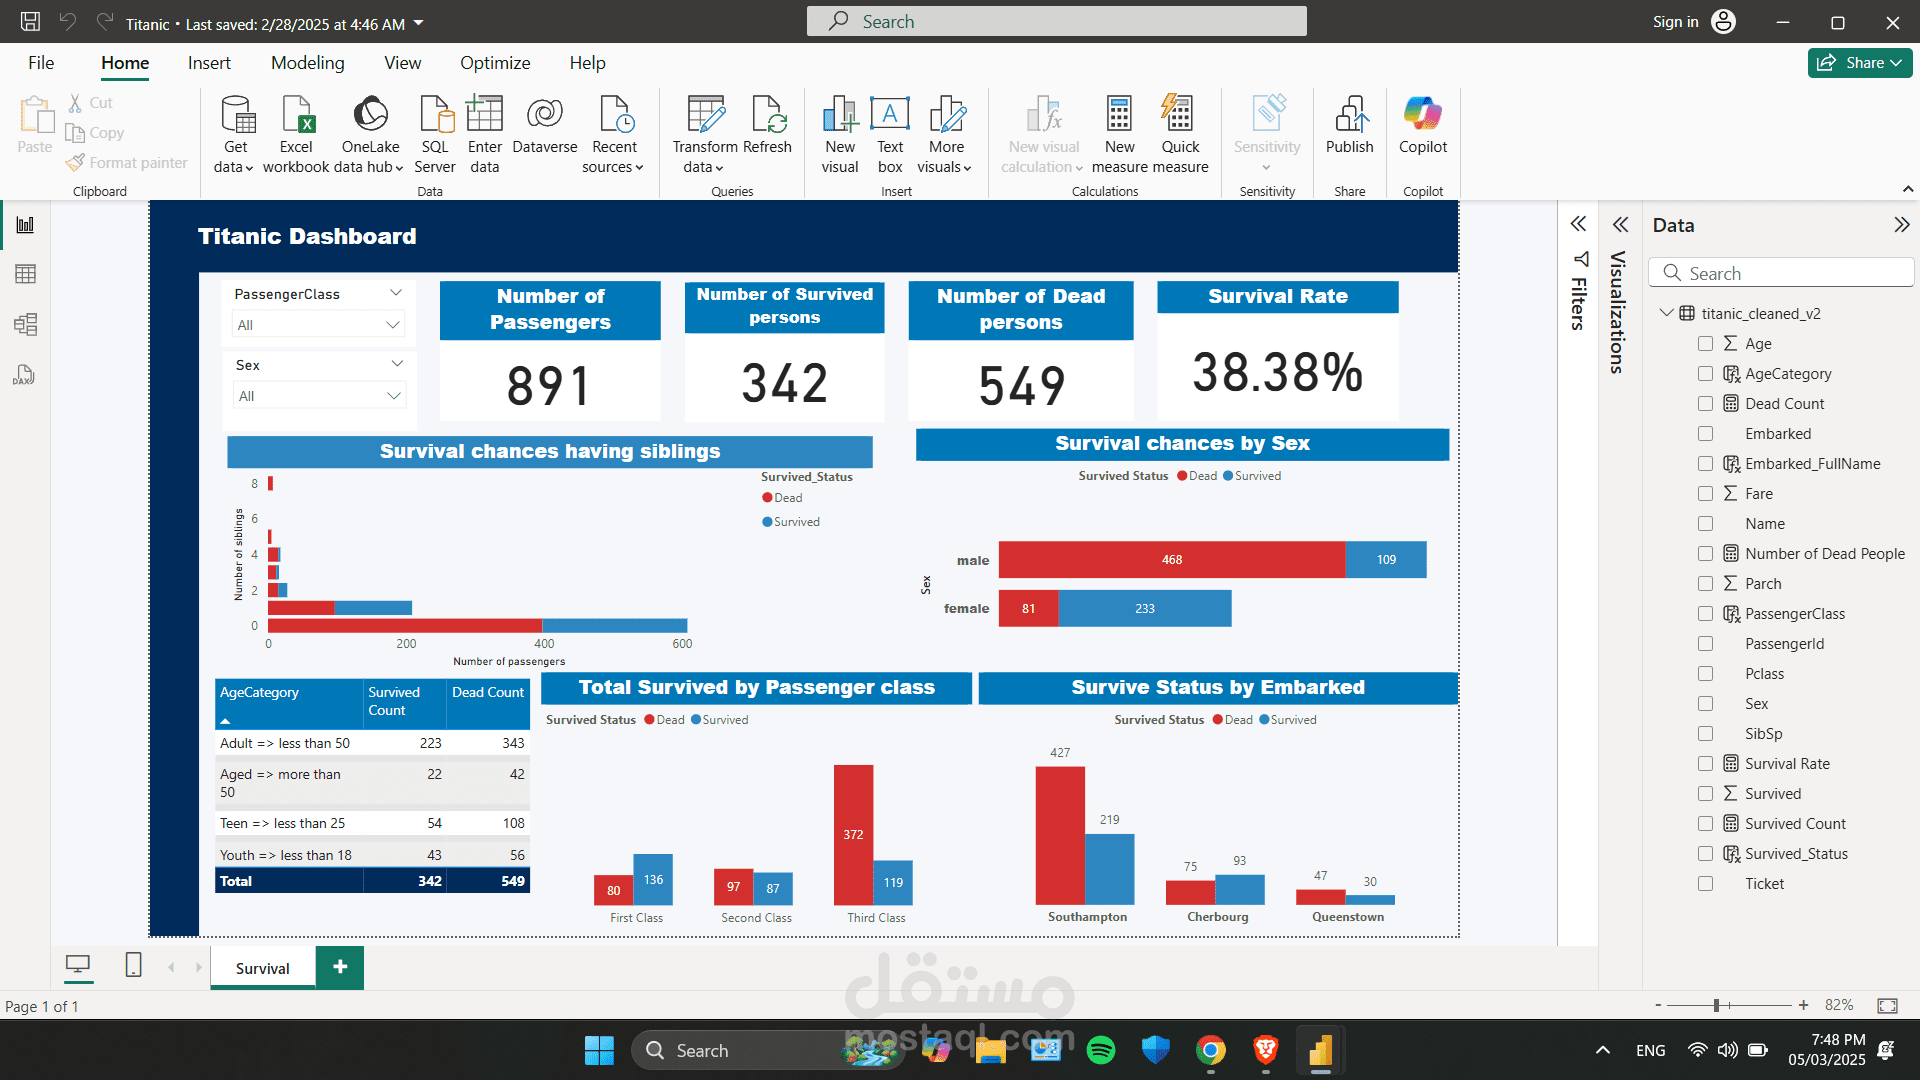
This Power BI dashboard provides a detailed analysis of passenger survival on the Titanic, offering key insights through interactive visualizations.
Features:
Interactive Filters – Easily filter data by Passenger Class and Gender for in-depth analysis.
Survival Summary – Displays key metrics, including total passengers, survivors, deceased, and survival rate.
Demographic Breakdown – Analyzes survival based on age group, gender, and class, highlighting significant trends.
Influencing Factors – Explores survival chances based on siblings, embarkation point, and class type.
Clear Visual Design – Uses color coding (red for deceased, blue for survived) for better readability.
Ideal for data analysis projects, research, and business intelligence applications, this dashboard transforms historical data into actionable insights.