Global Traffic Accidents Dashboard
تفاصيل العمل
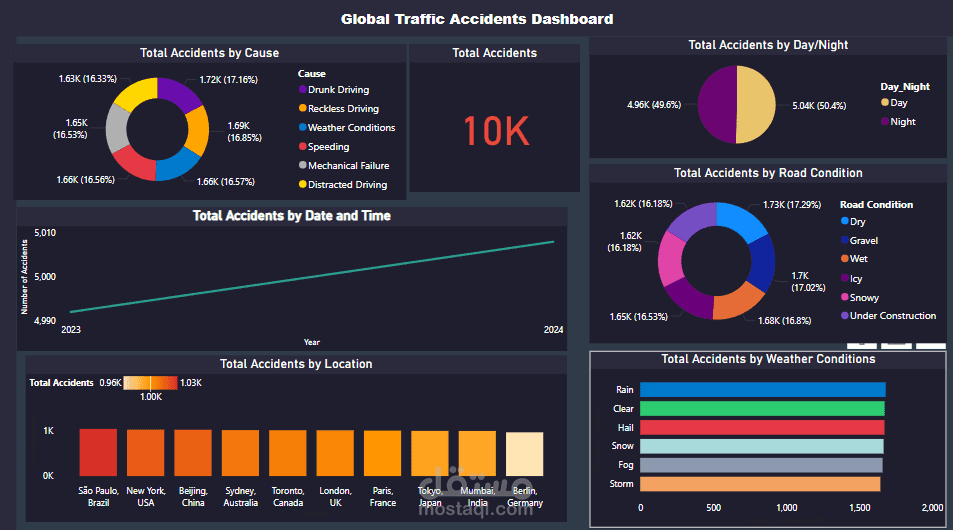
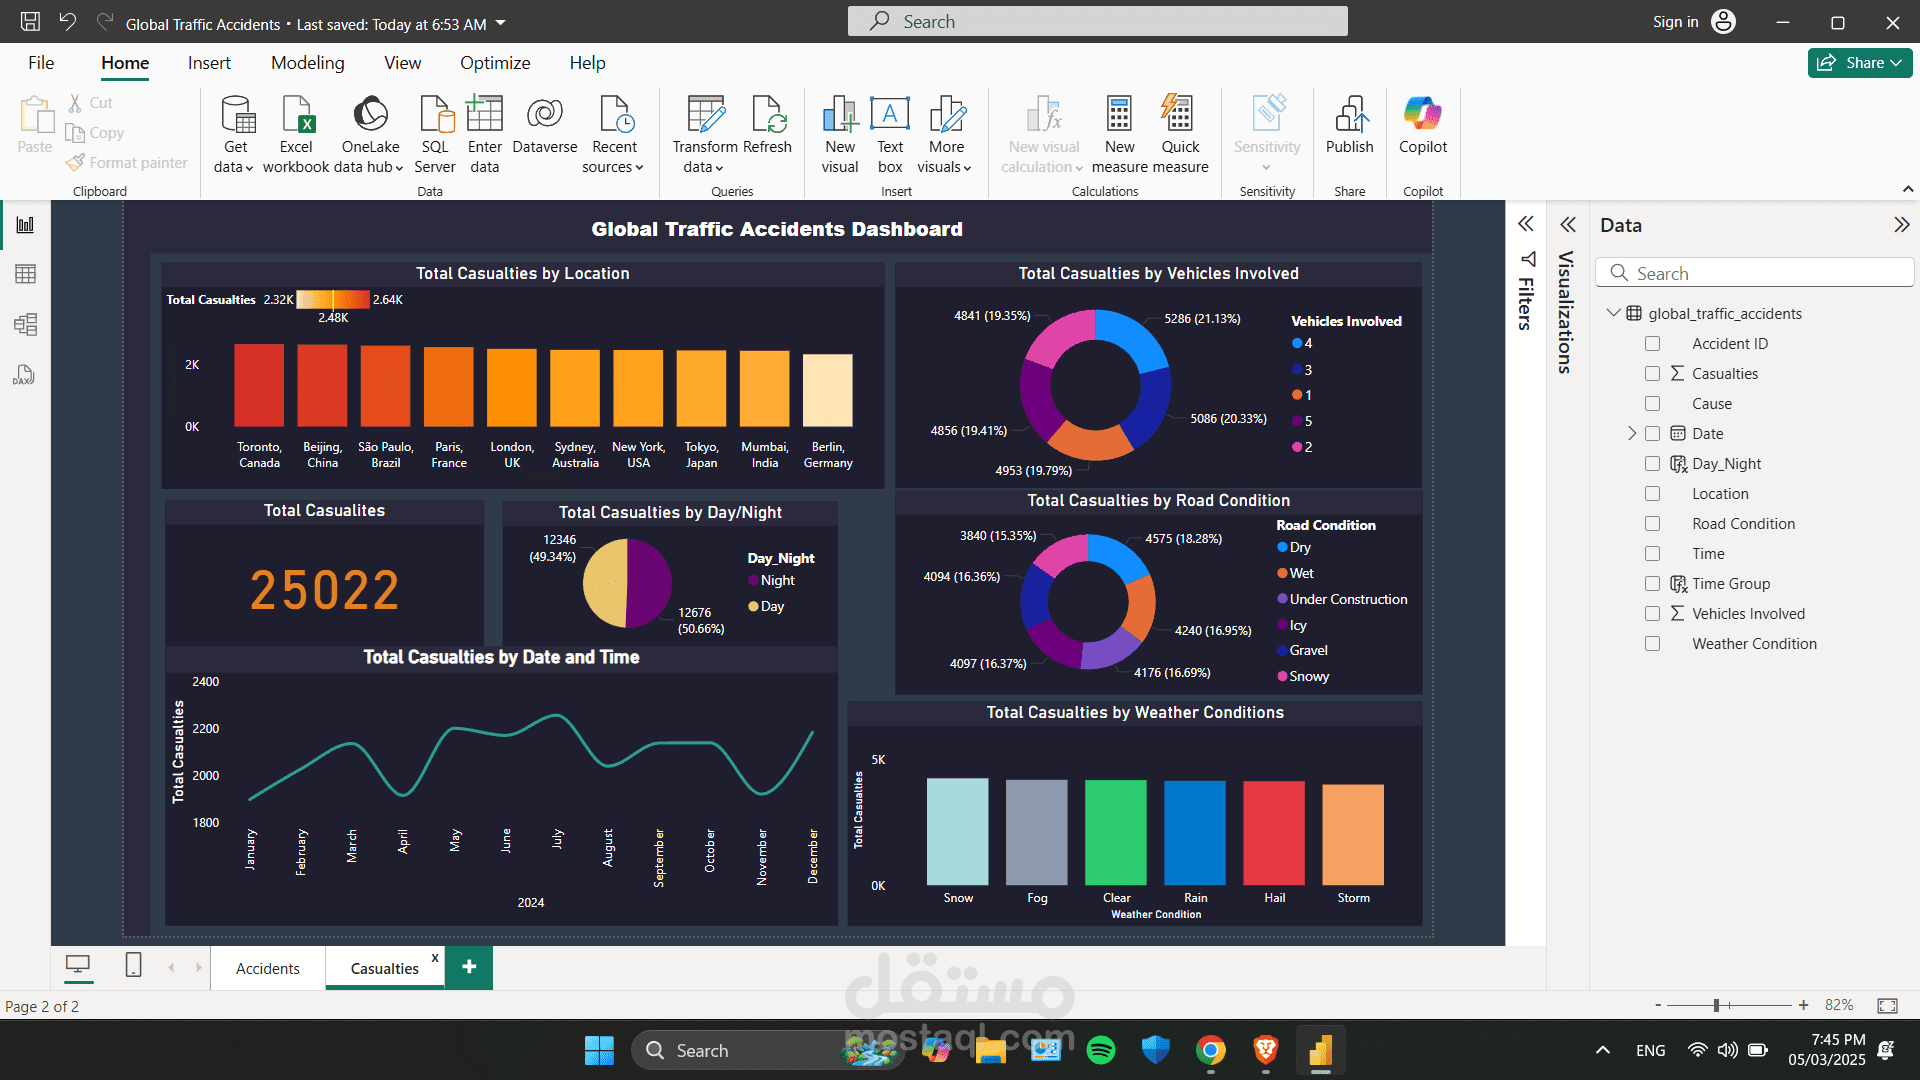
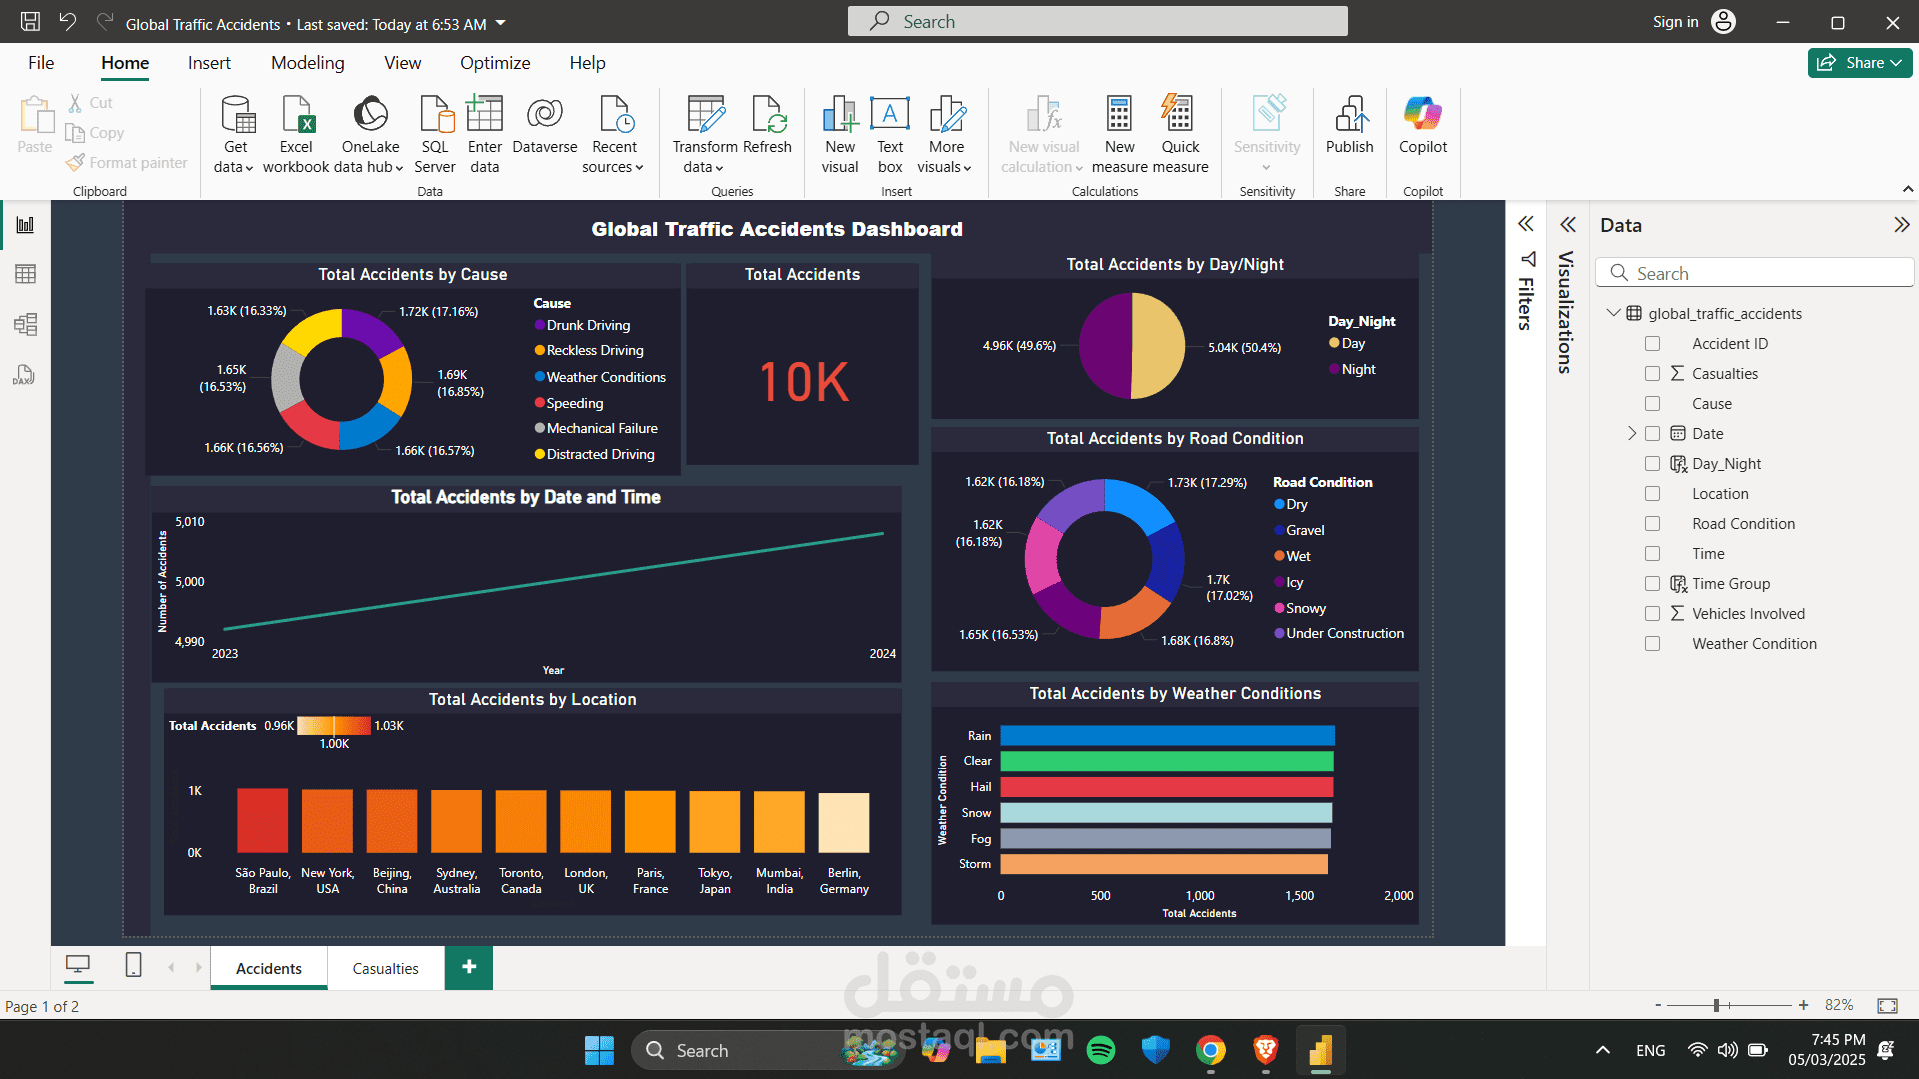
This interactive Power BI dashboard provides a comprehensive analysis of global traffic accidents, helping stakeholders make informed decisions based on key accident trends. It visualizes critical data, including accident causes, casualties, locations, time distribution, road conditions, and weather impact.
Key Features:
Total Accidents & Casualties Overview – Displays key figures to highlight the scale of incidents.
Accidents & Casualties by Location – Heatmaps and bar charts showing city-wise distributions.
Day vs. Night Analysis – Pie charts to compare accident rates during different times of the day.
Road & Weather Conditions Impact – Insights into how road and weather conditions affect accident severity.
Trend Analysis Over Time – A line chart tracking accident and casualty trends across years.
Vehicle Involvement Insights – Pie charts linking the number of vehicles involved to casualties.