Sales Data Analysis & Visualization Using Python | Trends, Best-Sellers & Order Insights
تفاصيل العمل
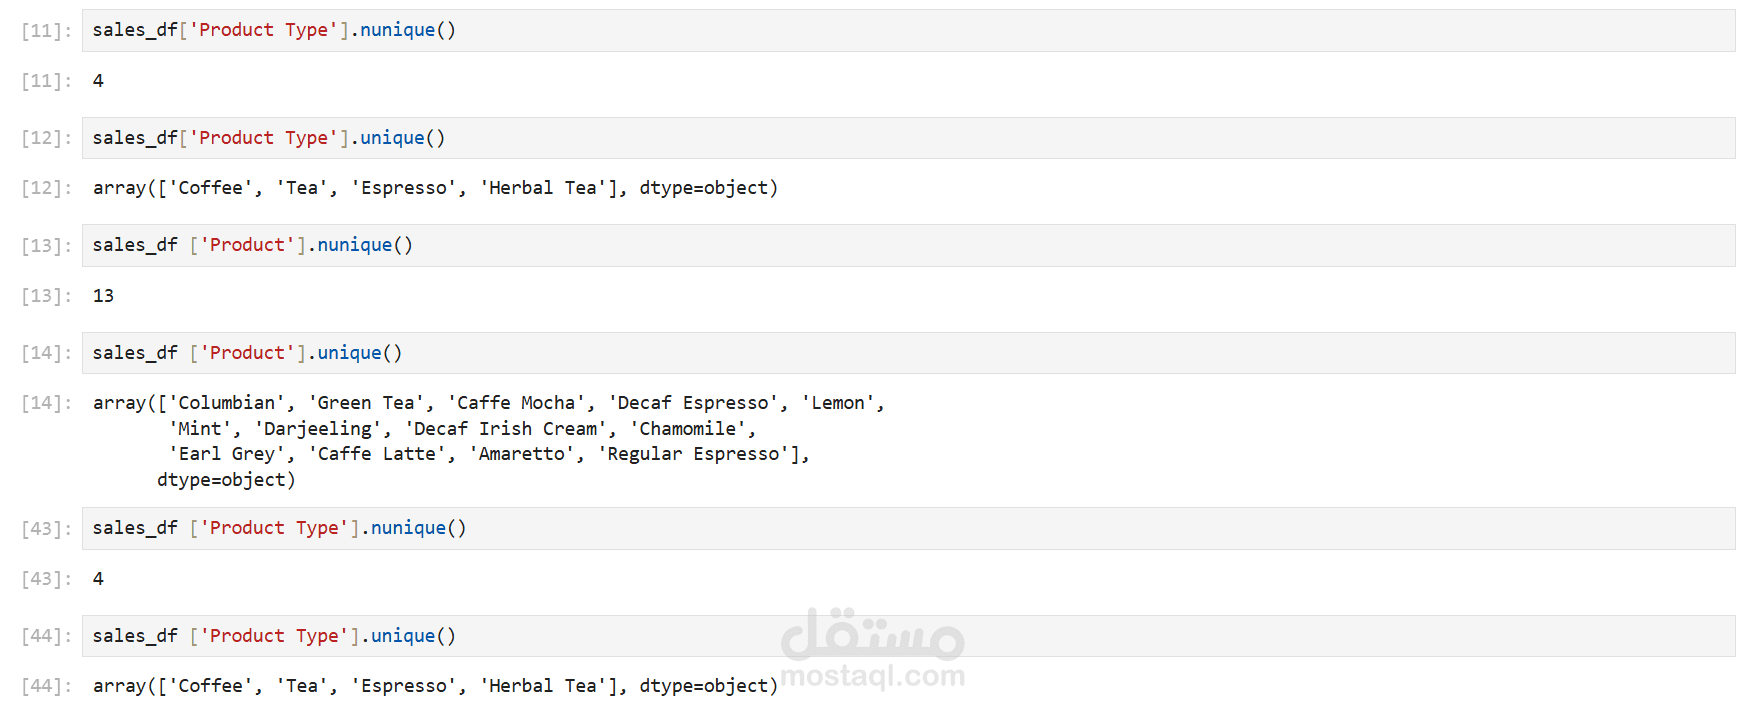
I worked on a sales database to analyze business performance using Python for data exploration and visualization. The dataset included key metrics such as sales, profit, costs, marketing expenses, and product details across different markets.
Project Highlights:
Data Cleaning & Preprocessing: Ensured data accuracy by handling missing values, correcting inconsistencies, and formatting date fields.
Sales Trend Analysis: Visualized sales performance over time to identify seasonal patterns and revenue trends.
Best-Selling Products: Determined the top-performing products based on revenue and order volume.
Order Trends: Analyzed the number of orders over time to track customer demand and purchasing behavior.
Market Insights: Explored sales distribution across different states and market sizes to identify key business opportunities.
Data Visualization: Used Matplotlib, Seaborn, and Pandas to create interactive and insightful visualizations.
By leveraging data-driven insights, businesses can optimize their sales strategies, improve inventory management, and enhance marketing effectiveness.