Data Visualization of Sales Database
تفاصيل العمل
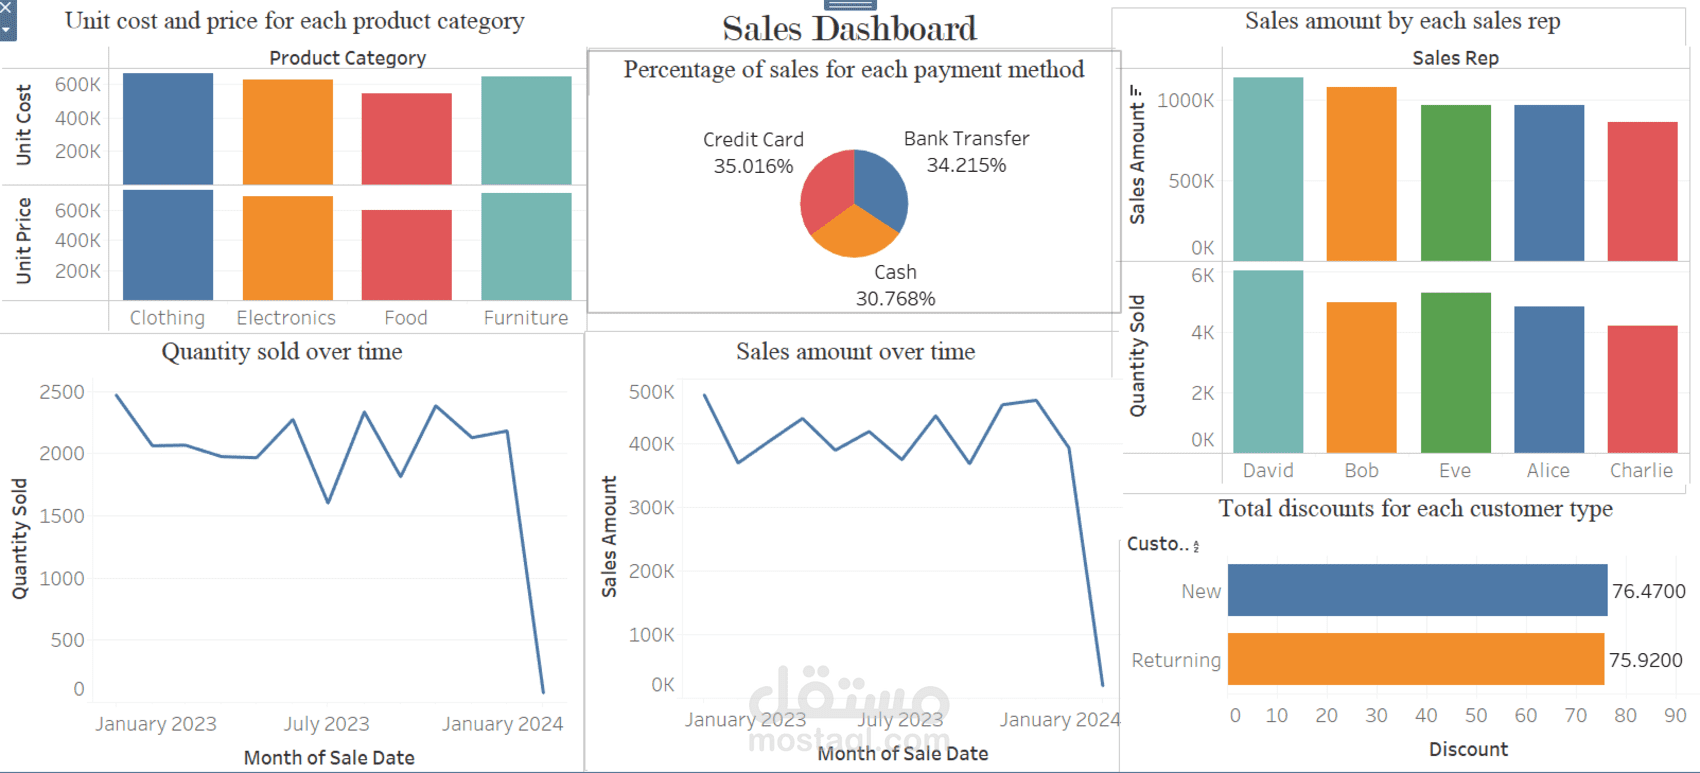
I created an insightful data visualization dashboard to analyze a sales database, providing valuable insights into business performance. This project involved:
Sales Trend Analysis: Tracking sales over time to identify patterns and seasonal fluctuations.
Best-Selling Products: Highlighting top-performing products based on revenue and quantity sold.
Order Volume Over Time: Monitoring the number of orders placed over different periods to understand customer demand.
Using Tableau tool, I transformed raw sales data into interactive dashboards with clear, visually appealing charts. These insights help businesses make data-driven decisions, optimize inventory, and improve sales strategies.