Instagram posts data analysis using python
تفاصيل العمل
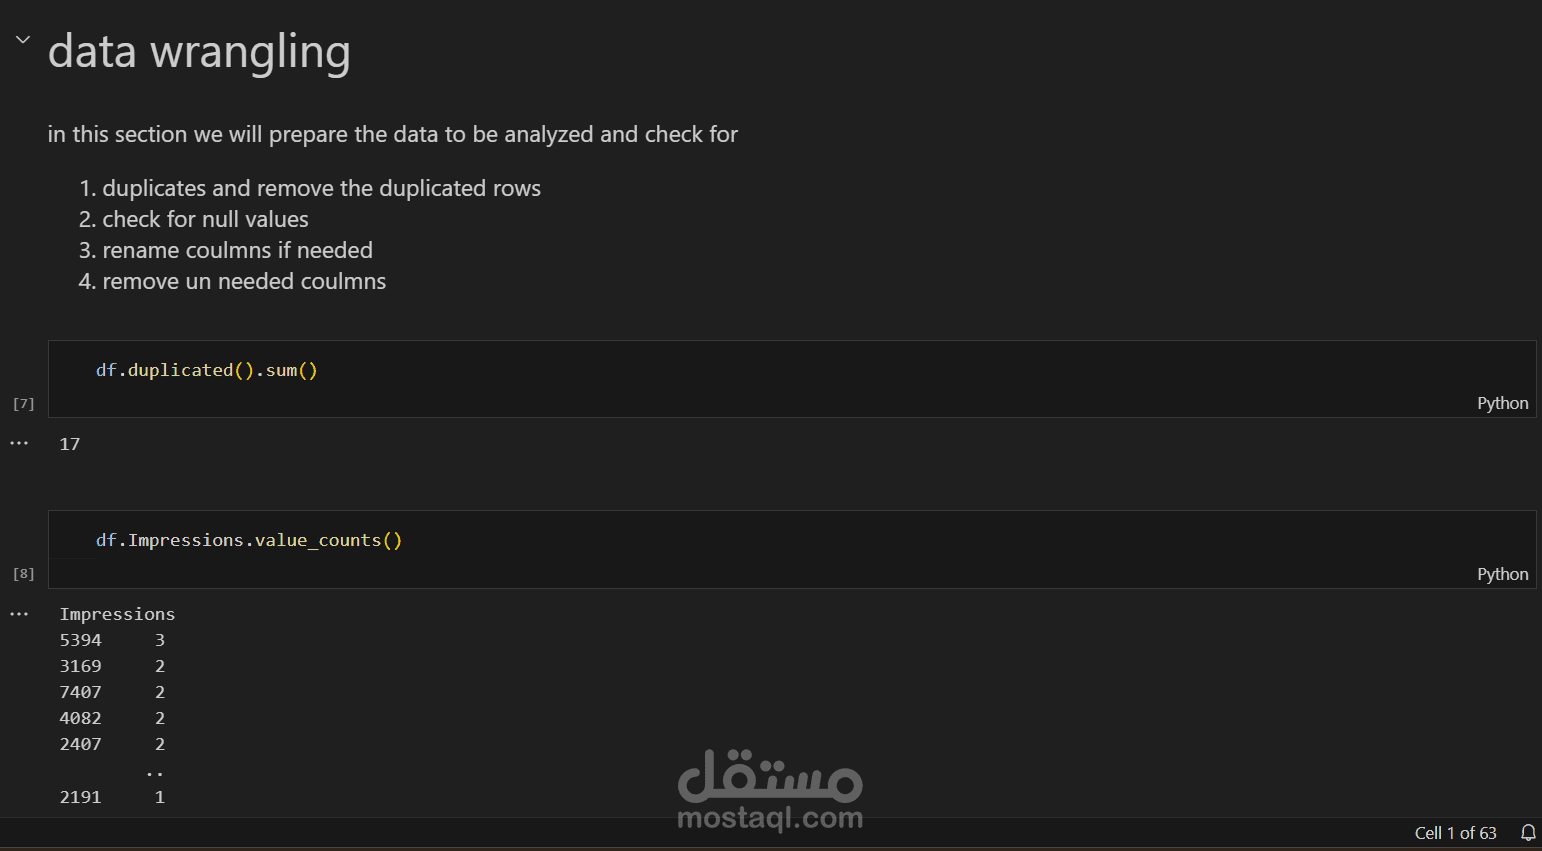
Project Overview
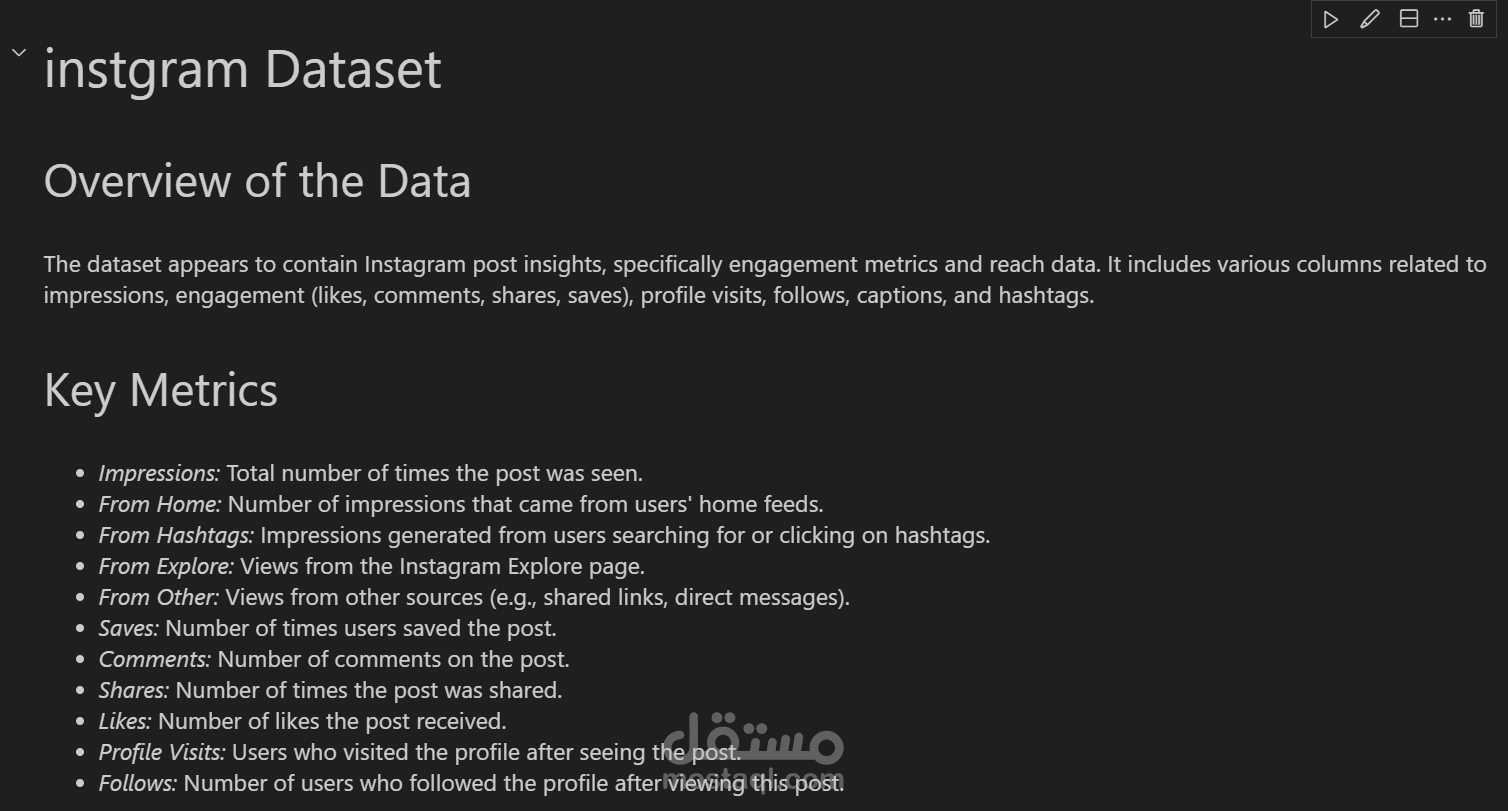
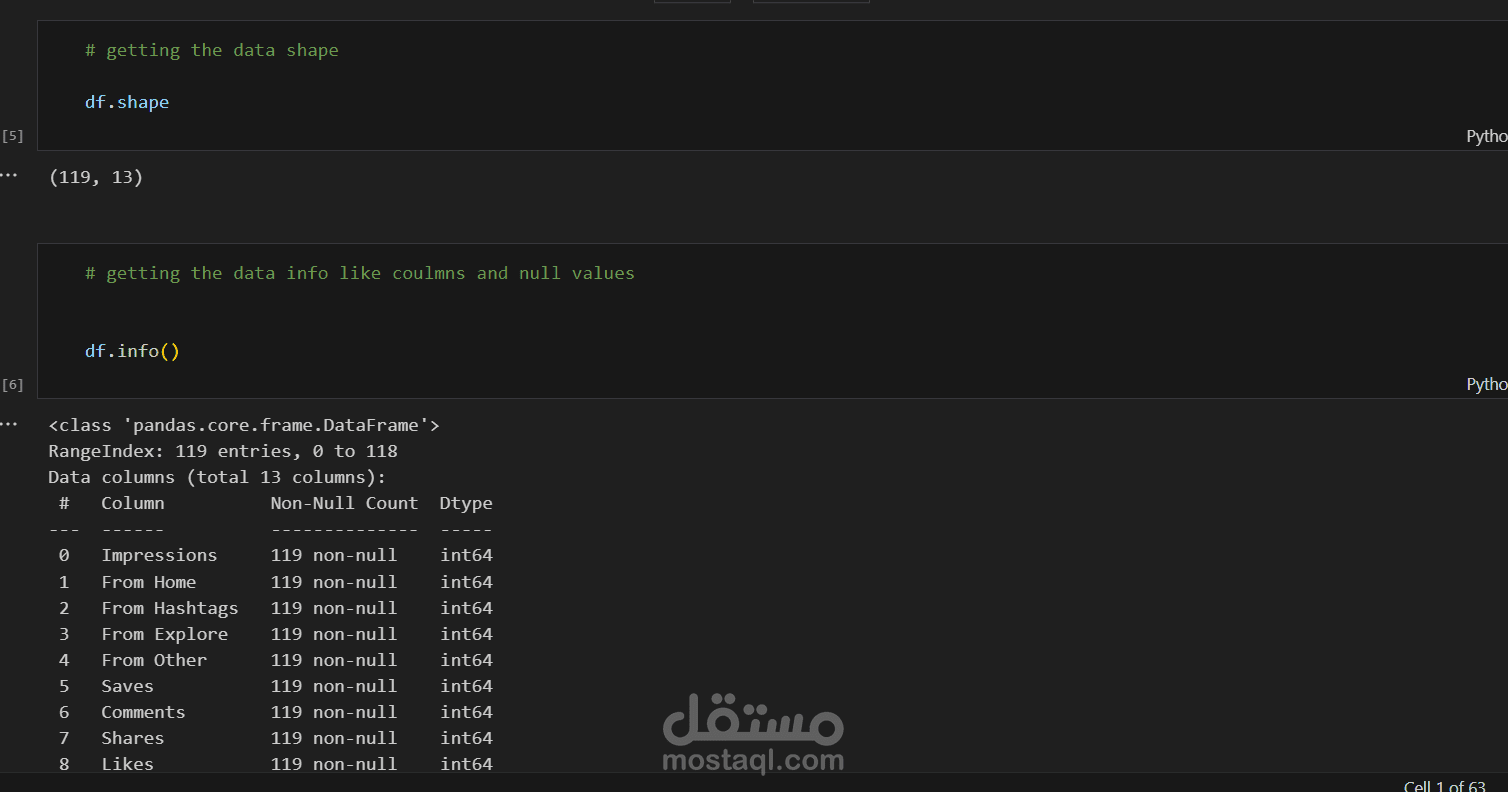
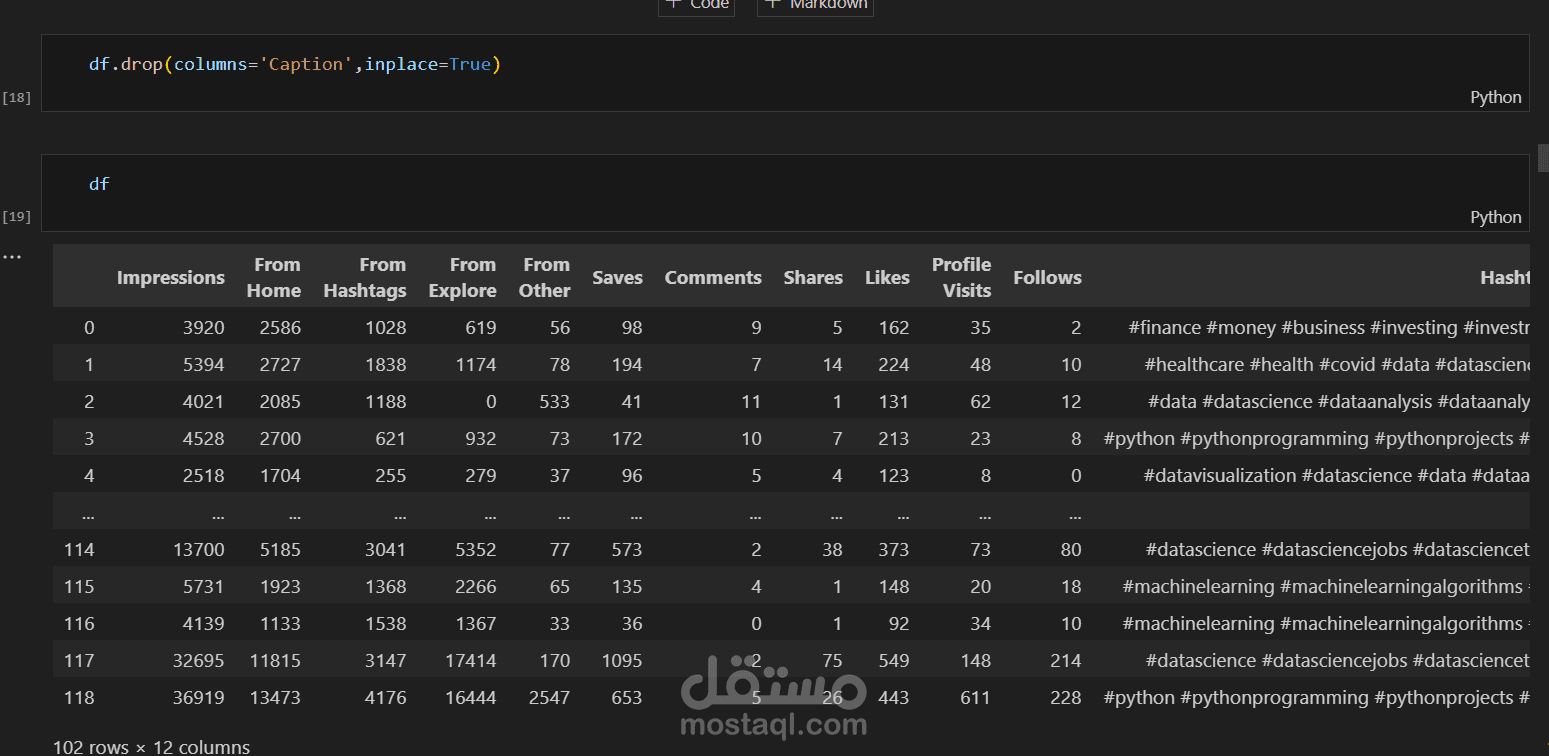
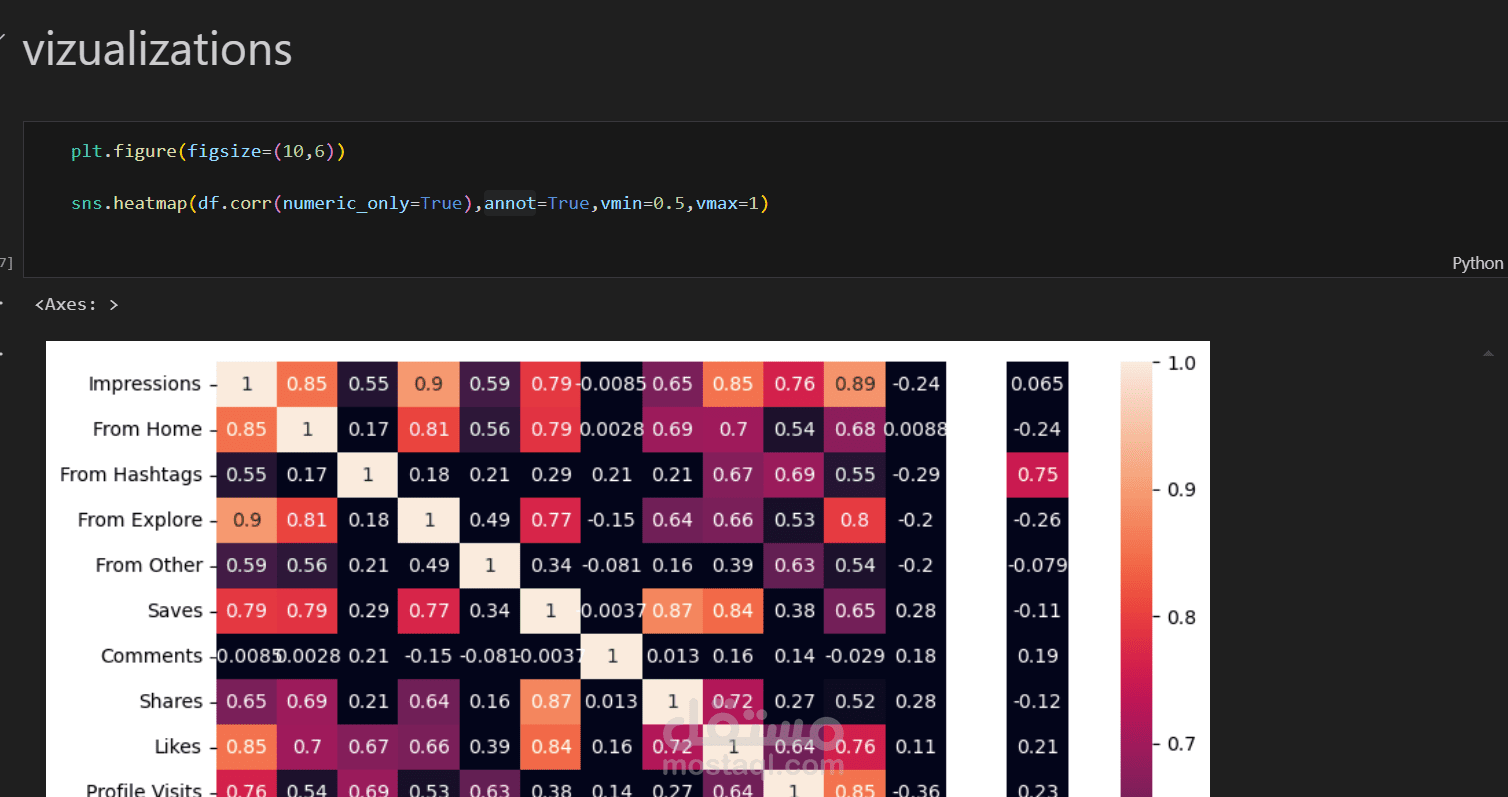
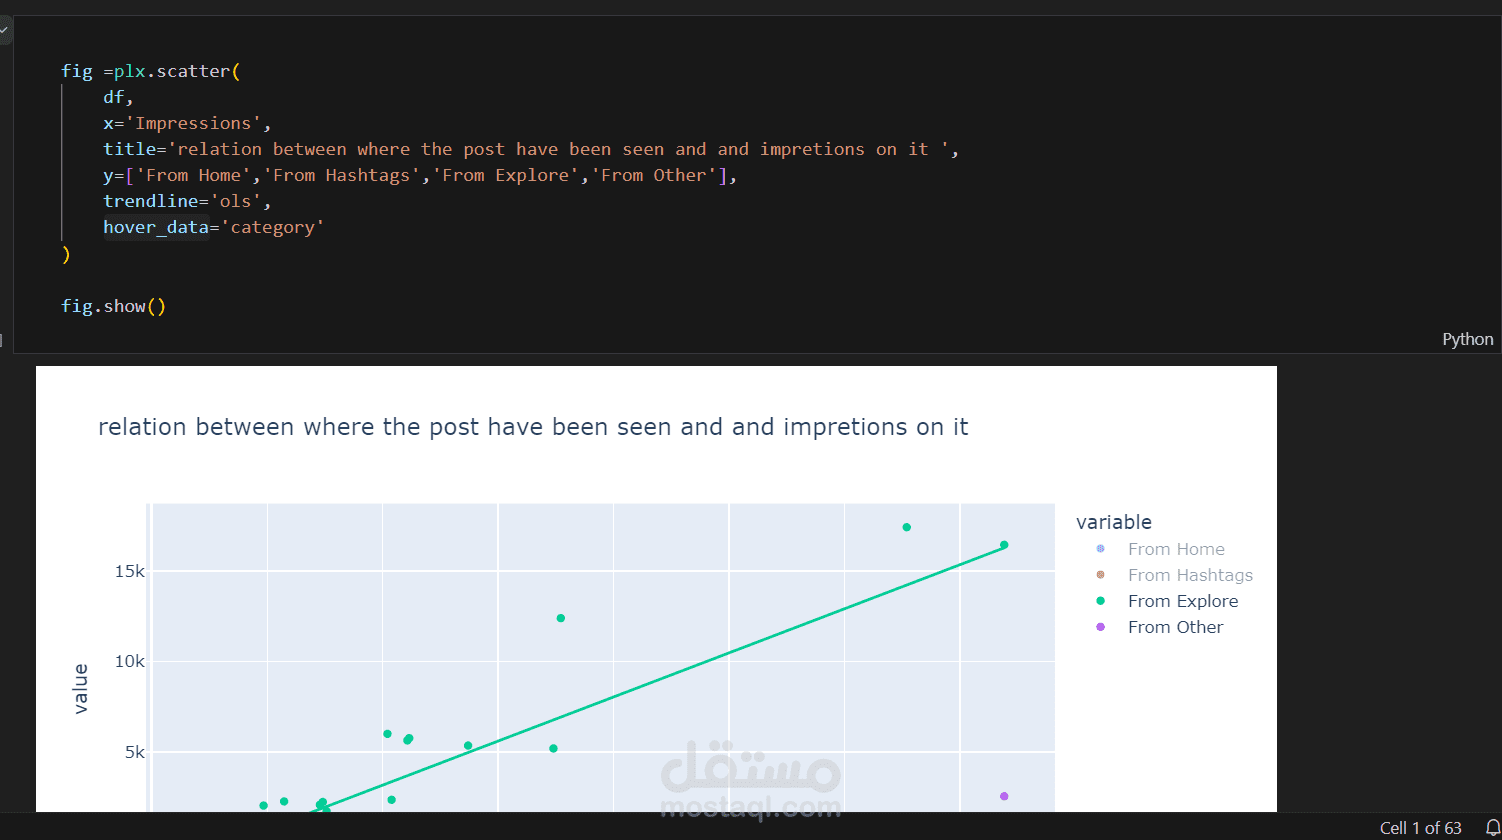
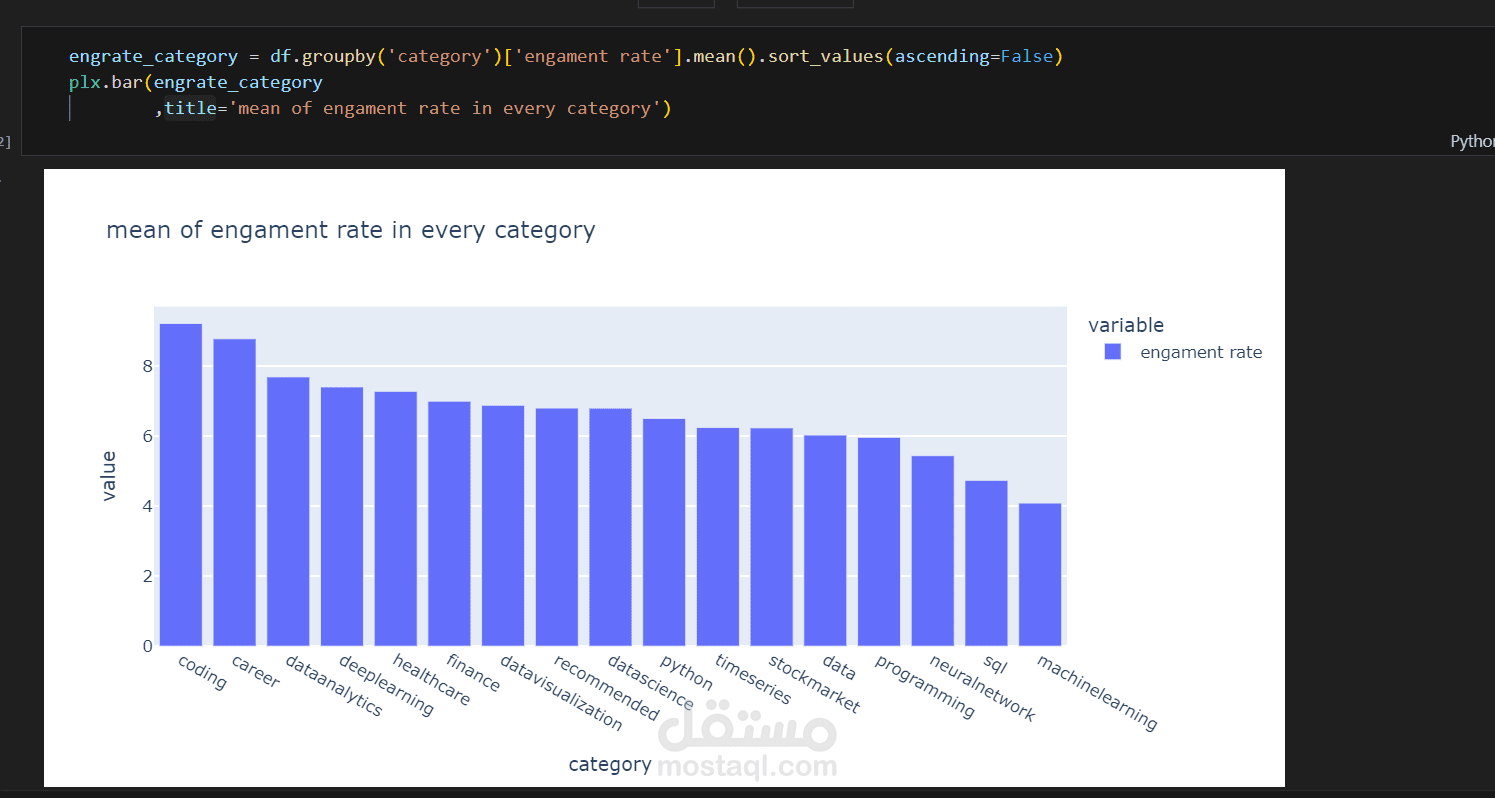
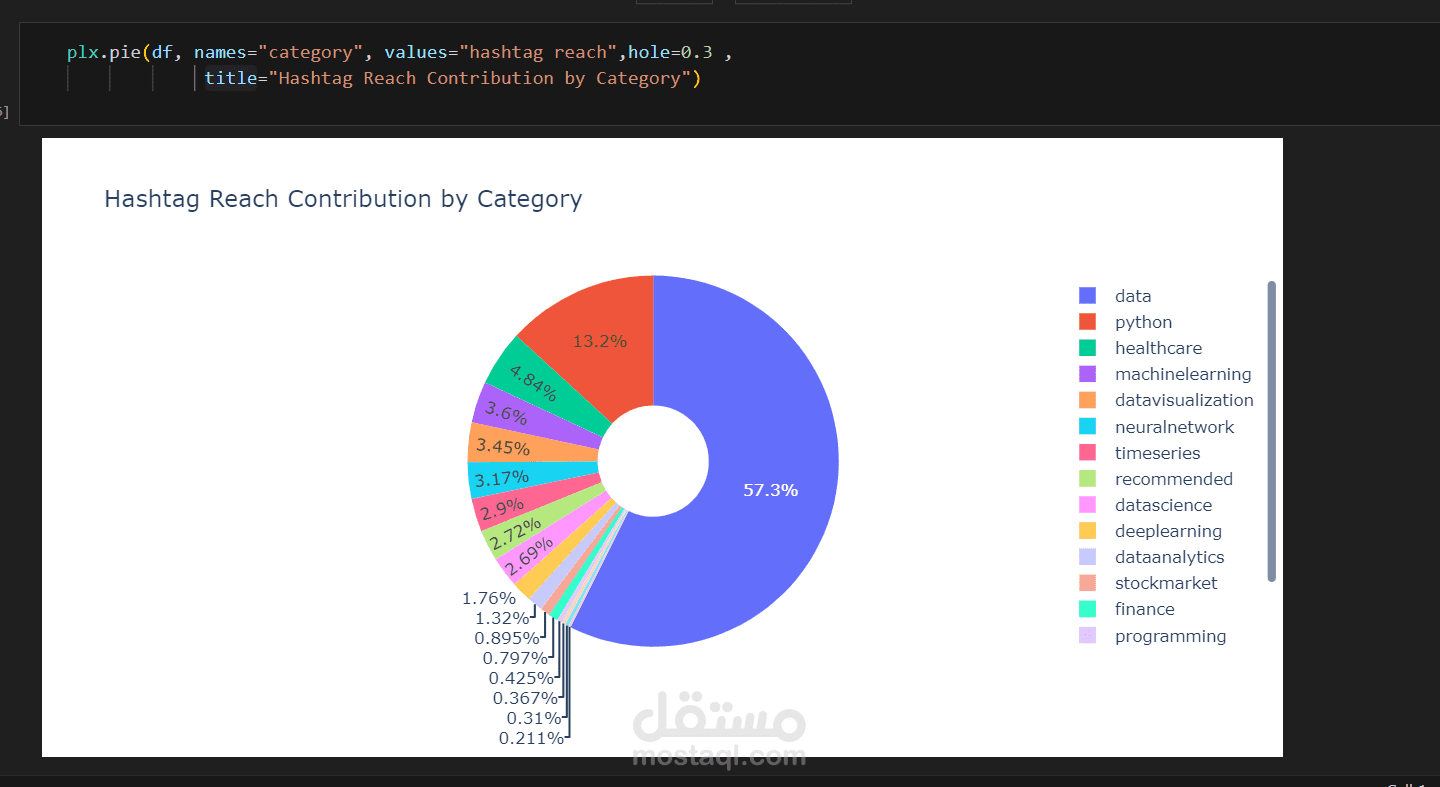
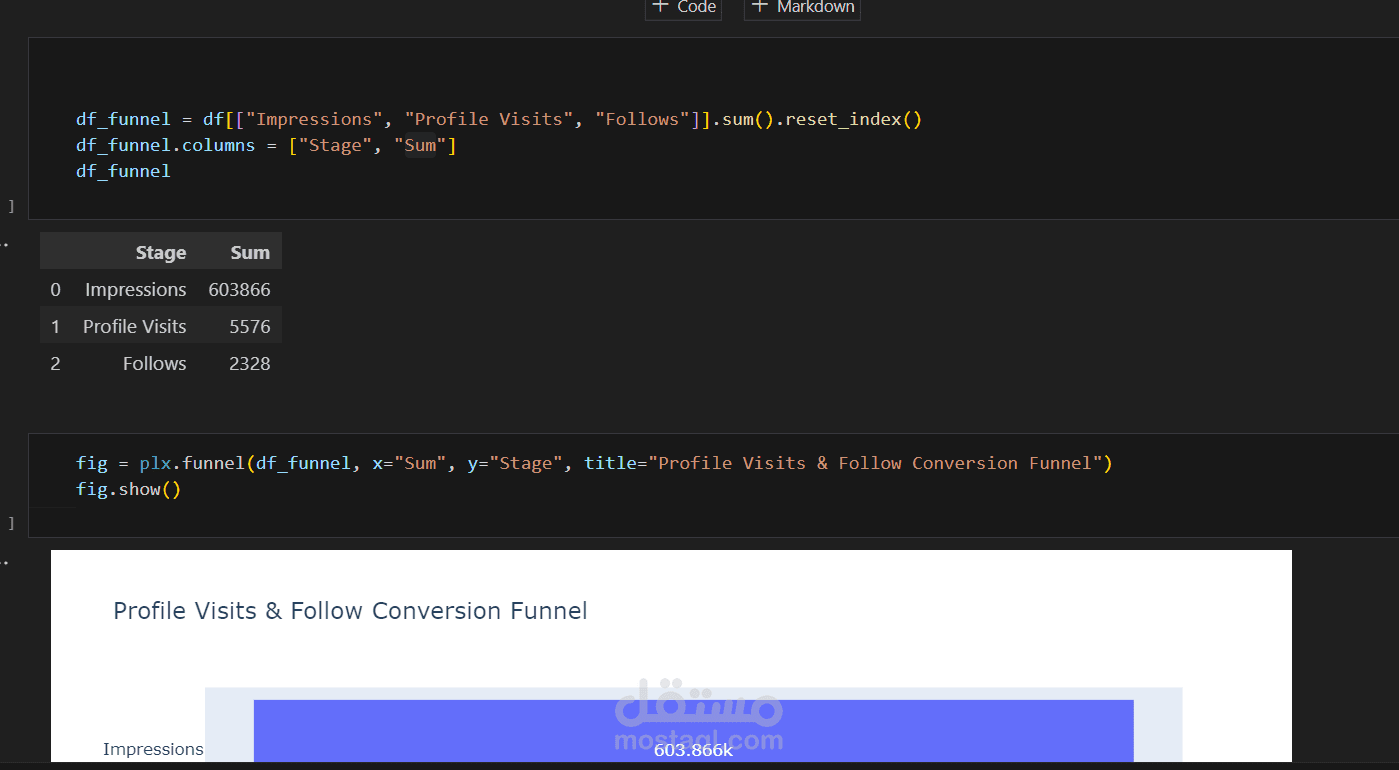
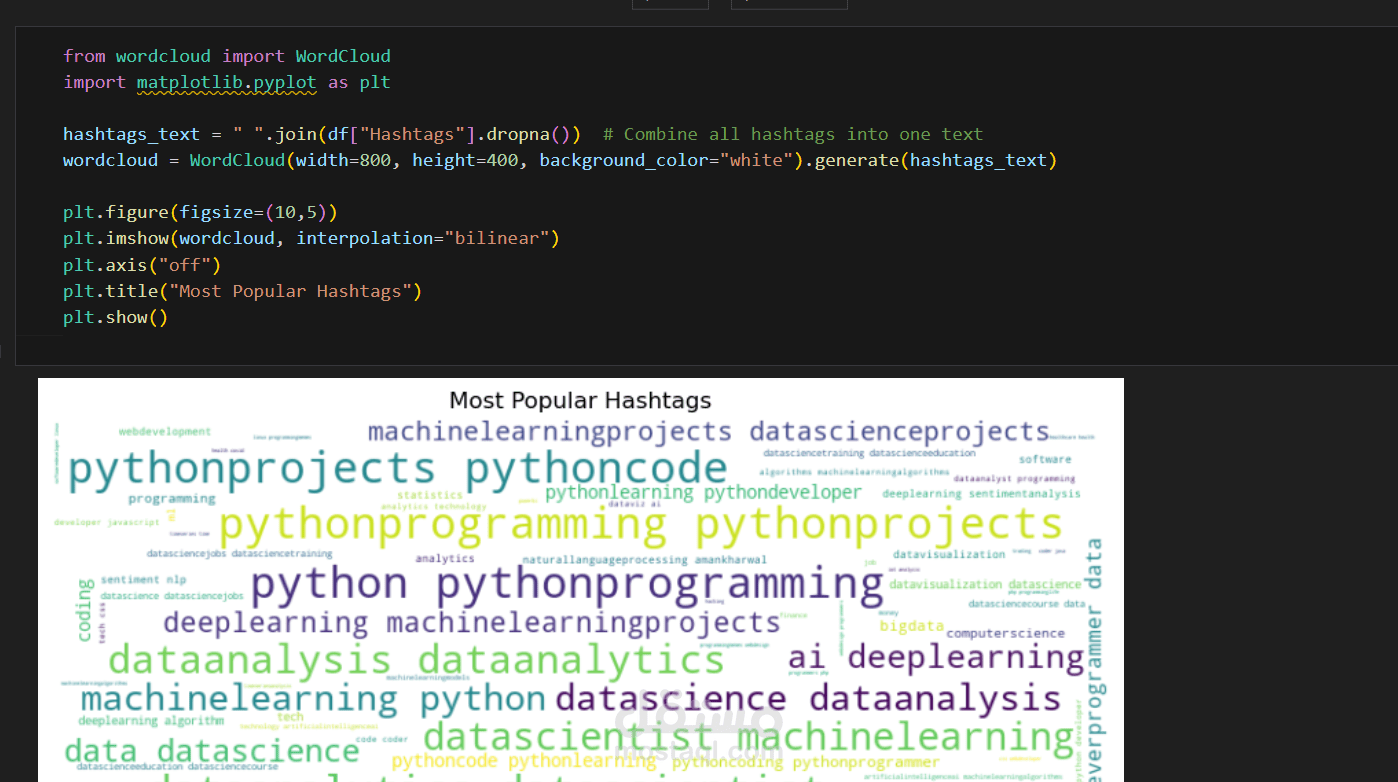
This project focuses on analyzing Instagram post insights to understand engagement patterns and reach trends. The dataset includes key metrics such as impressions, likes, comments, shares, saves, profile visits, follows, captions, and hashtags.
Tools & Libraries Used
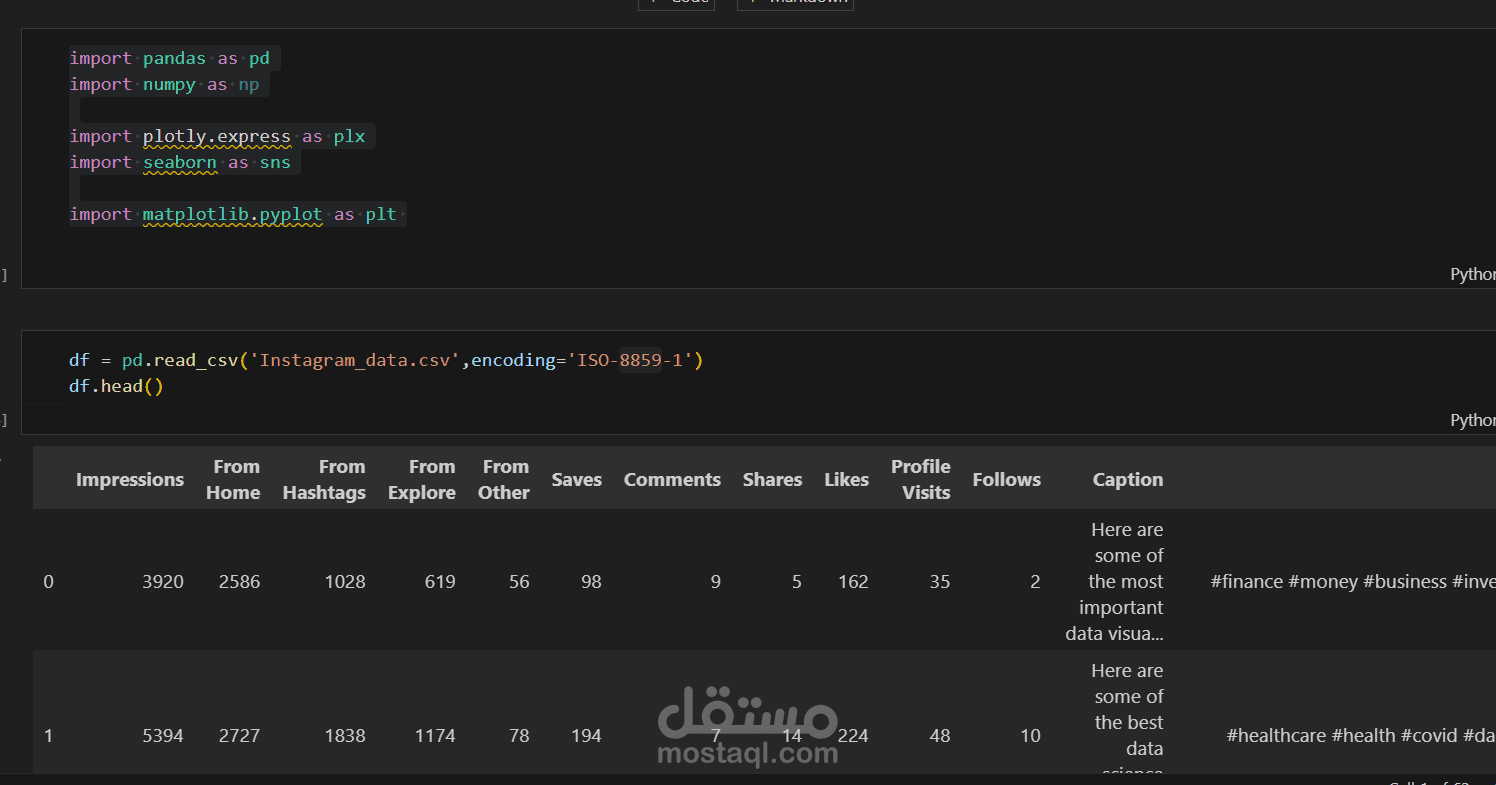
To perform data analysis and visualization, I utilized the following Python libraries:
pandas & numpy: For data manipulation and numerical computations.
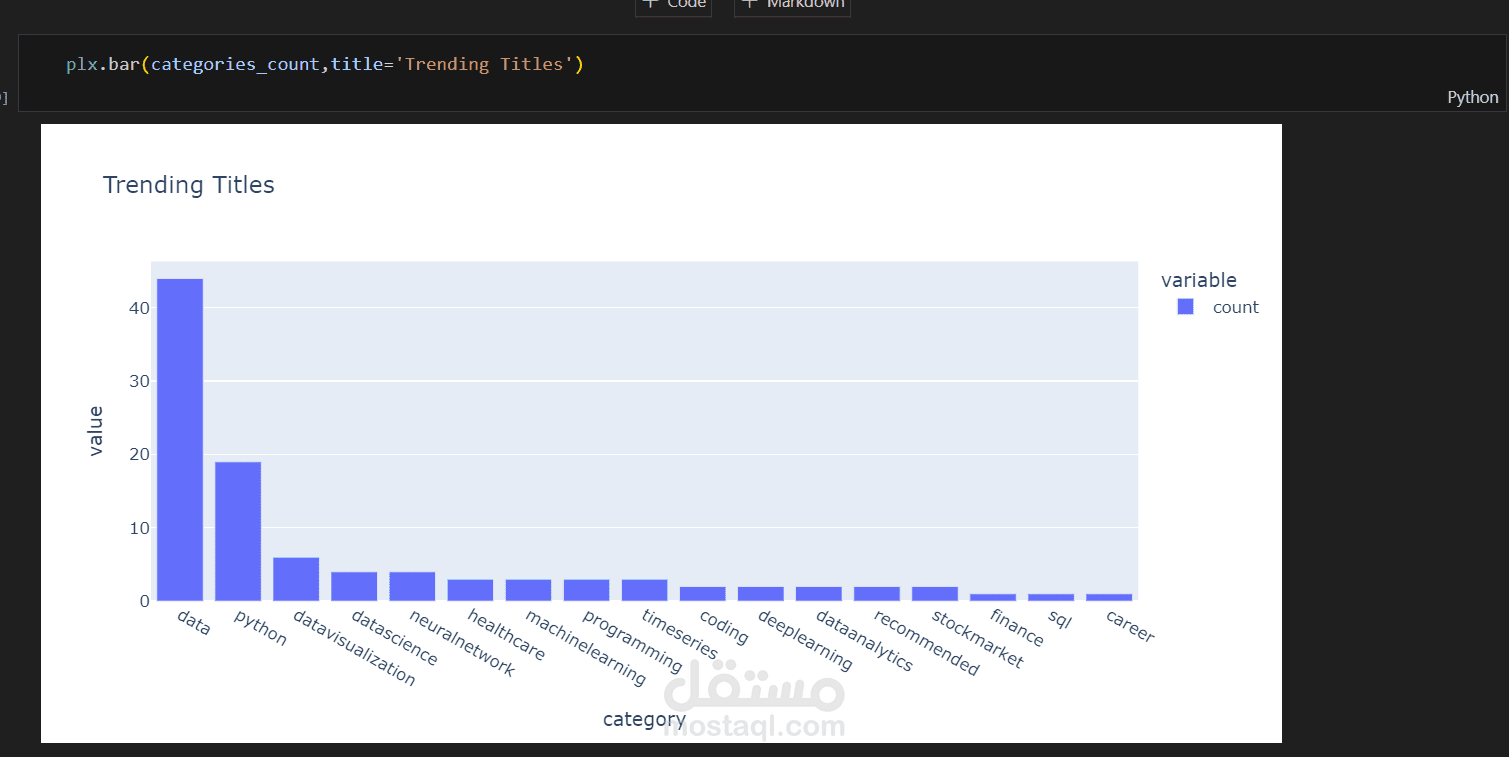
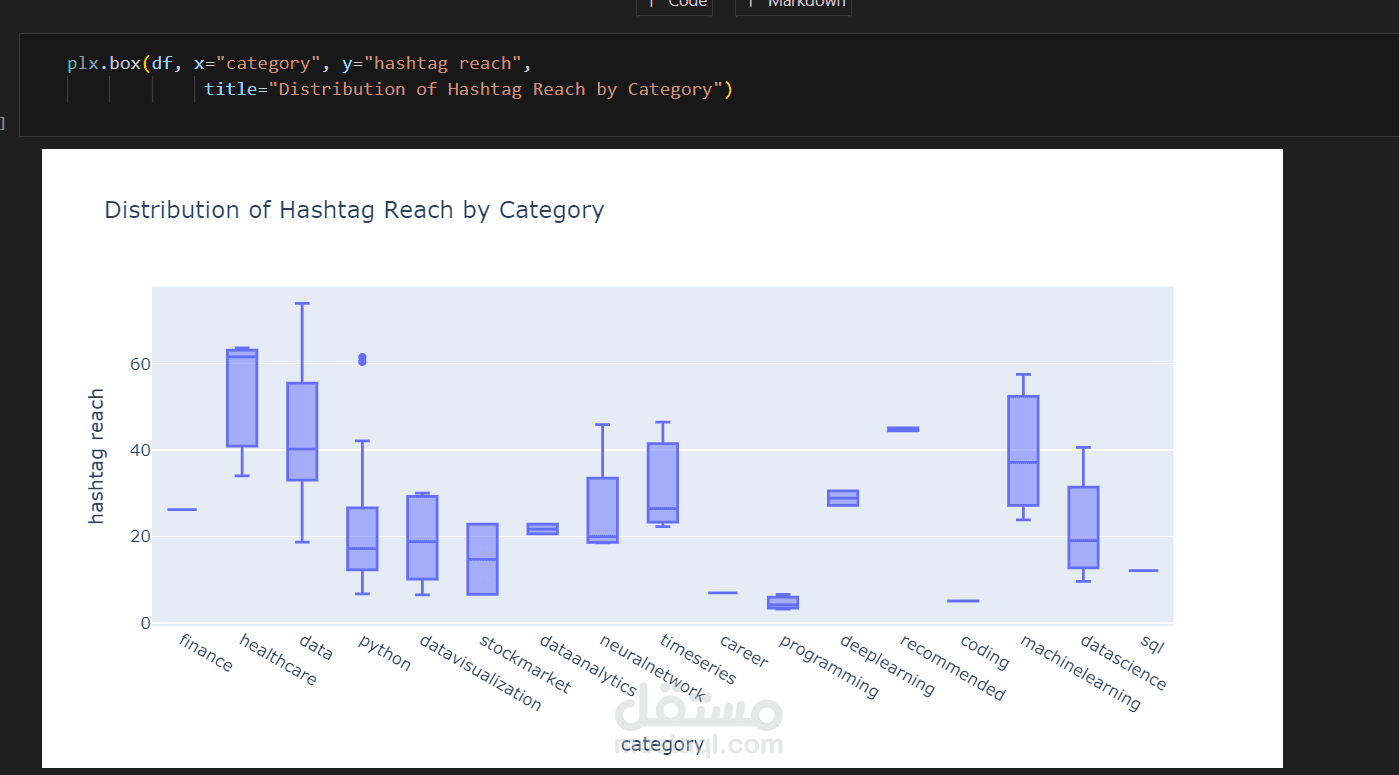
matplotlib, seaborn, & plotly.express: For exploratory data analysis and interactive visualizations.
Objective
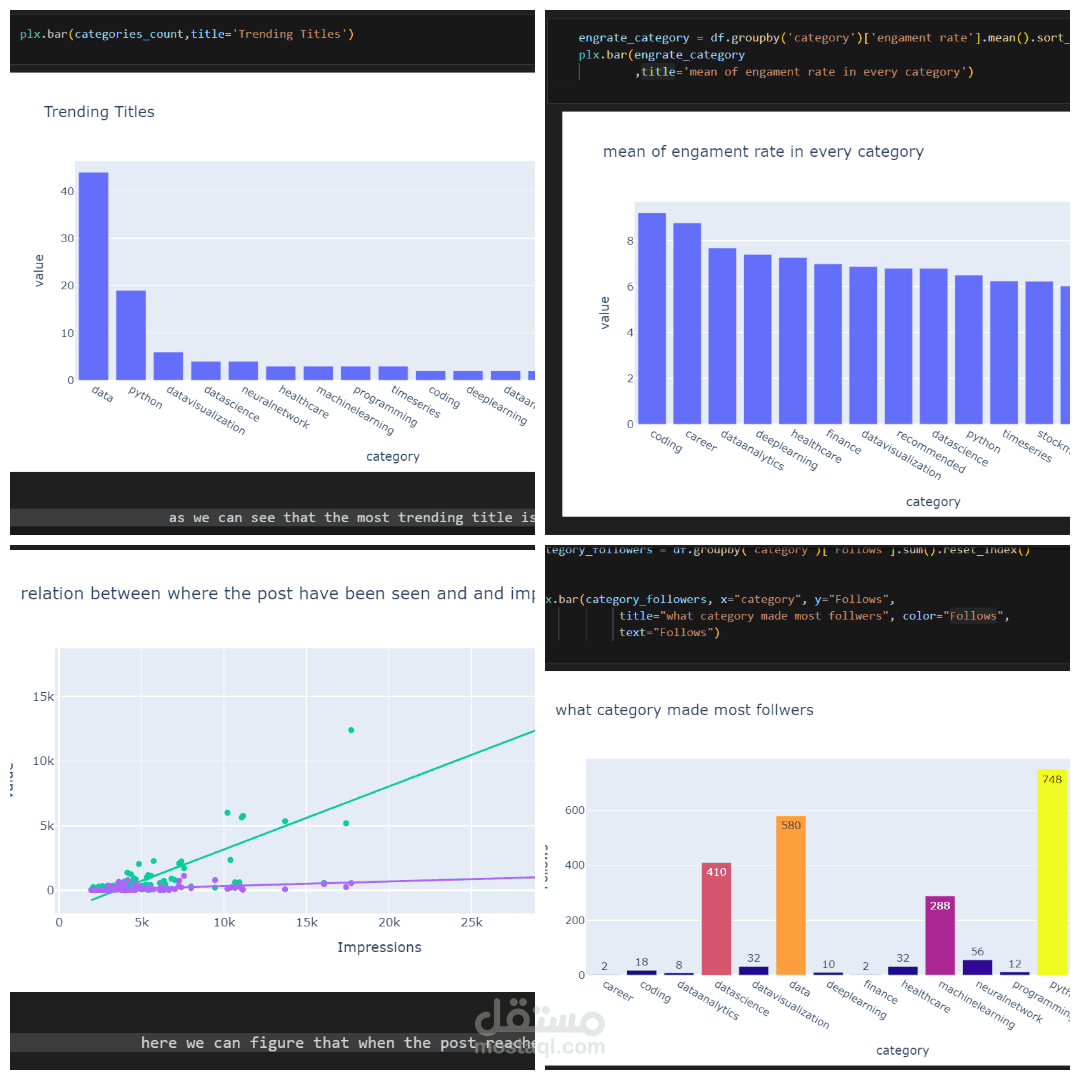
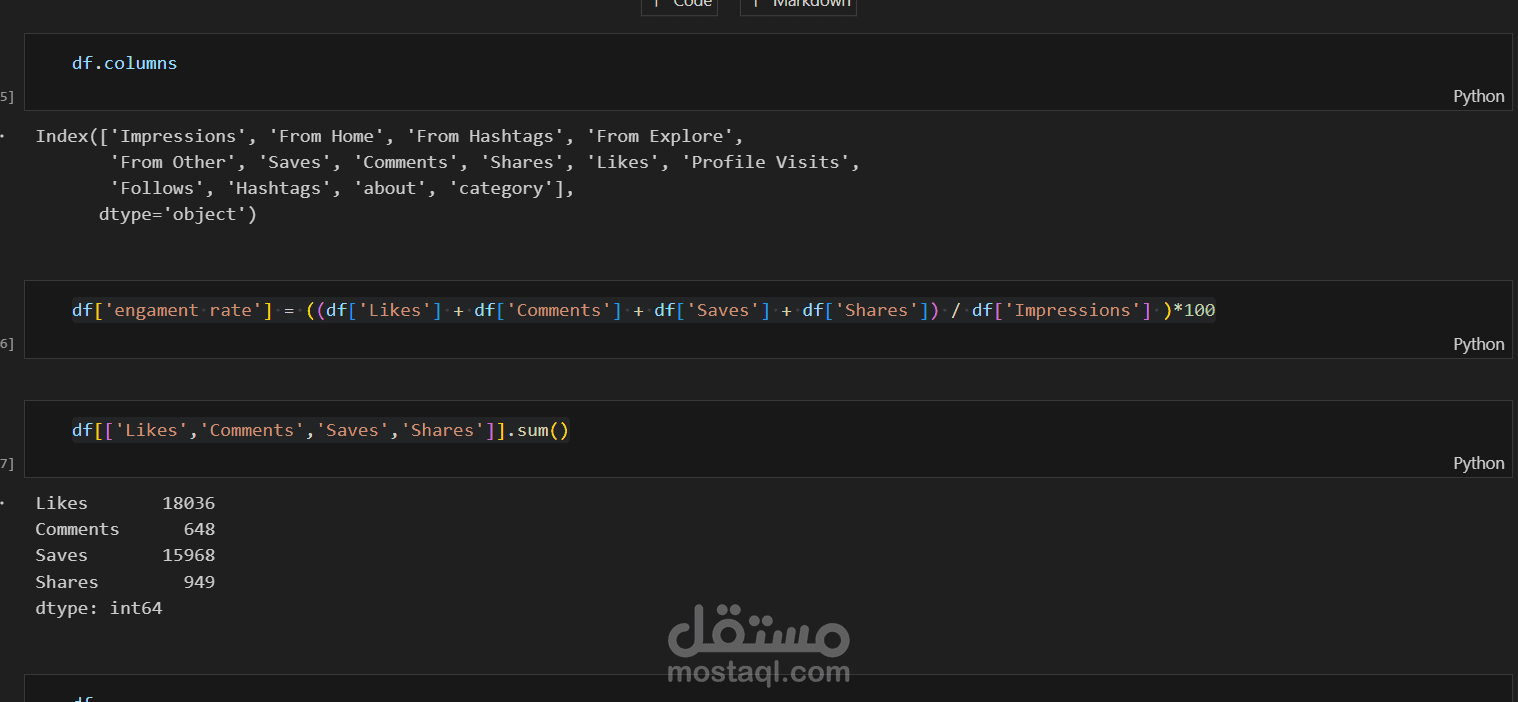
The goal of this analysis is to identify trends in user engagement, explore correlations between different metrics, and gain insights into what drives post performance. Through visualizations and statistical analysis, we aim to extract actionable findings that can optimize Instagram content strategies.
Would you like me to add more details on the methodology or specific insights derived from your analysis?