hotel booking dashboard
تفاصيل العمل
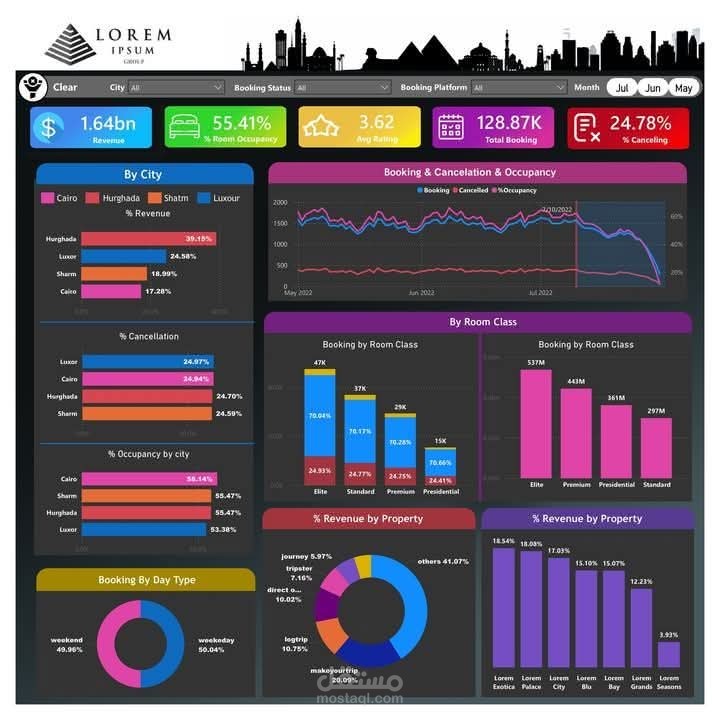
This image is a hotel booking dashboard featuring a data visualization of key performance metrics, including revenue, occupancy, cancellations, and booking trends across different cities and room classes. Below is a detailed breakdown:
Top Key Metrics:
Revenue: $1.64bn (represented in blue)
Room Occupancy: 55.41% (green)
Average Rating: 3.62 stars (yellow)
Total Bookings: 128.87K (pink)
Cancellation Rate: 24.78% (red)
City-Wise Analysis:
% Revenue Contribution:
Hurghada: 30.15%
Luxor: 24.58%
Sharm: 18.09%
Cairo: 17.28%
% Cancellation Rate:
Luxor: 26.47%
Cairo: 26.94%
Hurghada: 24.70%
Sharm: 24.59%
Occupancy Rate by City:
Cairo: 58.14%
Sharm: 55.47%
Hurghada: 55.87%
Luxor: 53.38%
Booking & Cancellation Trend:
A time-series line chart shows the fluctuation in bookings, cancellations, and occupancy over a period from May to July 2022.
Room Class Insights:
Booking by Room Class:
Elite: 47K bookings (70.94%)
Standard: 37K bookings (74.71%)
Premium: 29K bookings (70.76%)
Presidential: 15K bookings (76.66%)
Revenue by Room Class:
Elite: $537M
Premium: $463M
Presidential: $361M
Standard: $297M
Revenue Breakdown:
By Property:
Lorem Exotic: 18.14%
Lorem Palace: 15.10%
Lorem Club: 15.07%
Lorem Bay: 12.32%
Lorem Grand Sands: 3.93%
By Booking Platform:
Others: 41.07%
Minkyourtrip: 20.09%
Logtrip: 10.74%
Direct: 10.02%
Tripster: 6.07%
Journey: 5.97%
Booking Patterns:
By Day Type:
Weekend: 49.48%
Weekday: 50.64%
This dashboard provides comprehensive hotel performance data and is useful for making data-driven decisions in hospitality management.