Report Global Super Store 2011-2015
تفاصيل العمل
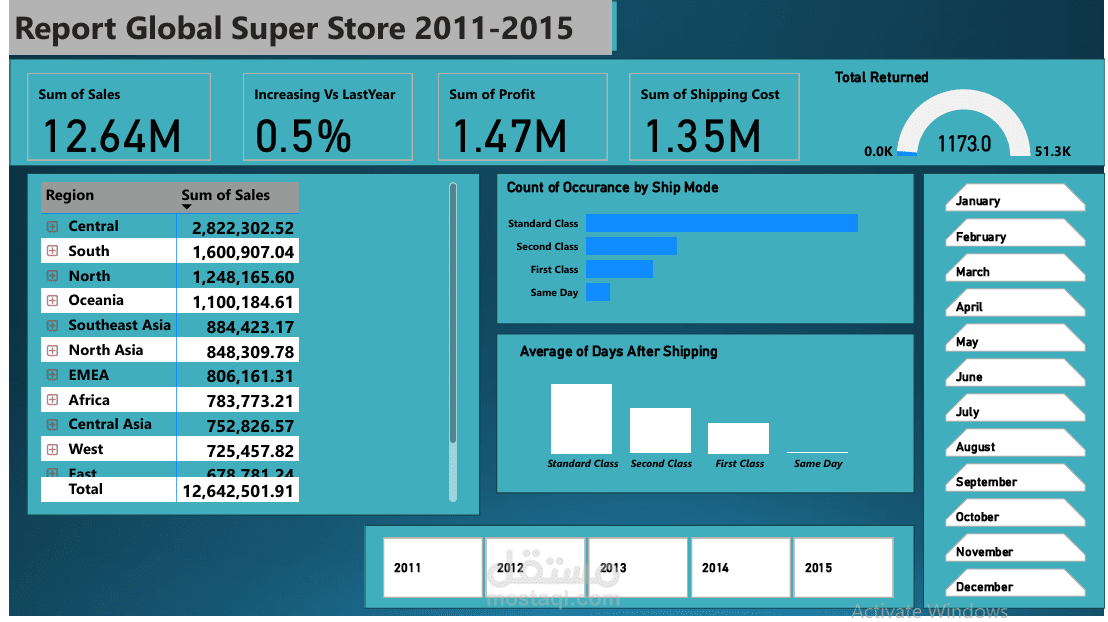
This project is a data analysis of a global retail store using Power BI and Excel, covering sales data from 2011 to 2015. The goal is to provide comprehensive insights into sales performance, profitability, and market trends, helping in strategic decision-making.
Project Objectives:
Sales & Revenue Analysis:
Identify total annual sales and trends over the years.
Determine the top-selling categories and products.
Profit & Loss Analysis:
Identify the most profitable regions.
Analyze products with high and low-profit margins.
Customer Behavior Analysis:
Identify key customers based on purchase history.
Study factors influencing buying decisions.
Geographical & Market Analysis:
Compare sales performance across different regions and countries.
Identify underperforming markets that need improvement.
Tools Used:
Excel: Data cleaning, pivot tables, and basic analytics.
Power BI: Interactive dashboards with charts, tables, and visual analysis.
Final Deliverables:
An interactive dashboard displaying sales and profitability trends.
Analytical reports highlighting sales patterns and customer behavior.
Actionable recommendations to improve performance and increase revenue.