data analysis
تفاصيل العمل
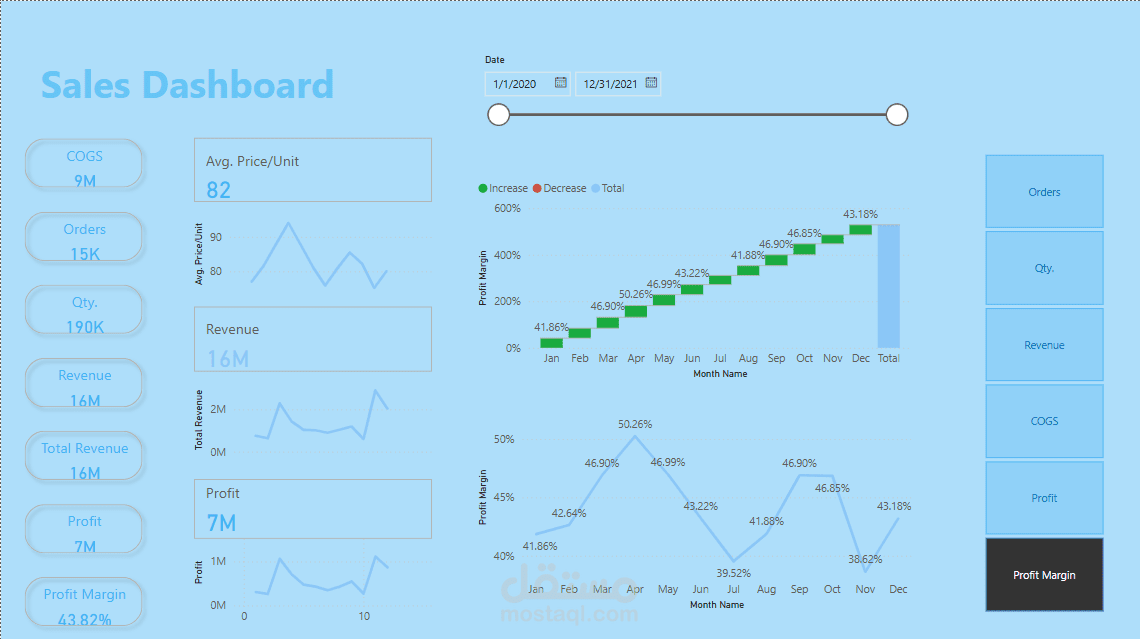

Sales Performance Dashboard Overview
This Sales Dashboard provides a comprehensive view of key financial and operational metrics to track business performance over time. It enables data-driven decision-making by analyzing revenue, profit, cost of goods sold (COGS), order volume, and profit margins.
Key Features & Insights:
Financial Overview:
Total Revenue: $16M
Total Profit: $7M
Cost of Goods Sold (COGS): $9M
Profit Margin: 43.82%
Sales Performance:
Total Orders: 15K
Total Units Sold: 190K
Avg. Price per Unit: $82
Trend Analysis:
Line charts track revenue, profit, and price fluctuations over time.
A waterfall chart visualizes monthly profit margin changes, highlighting areas of growth and decline.
Interactivity & Filtering:
A date range filter (2020-2021) allows users to analyze performance over specific periods.
Sidebar buttons enable quick filtering of key metrics like Orders, Revenue, Profit, and COGS.
Purpose & Use Case:
This dashboard helps businesses monitor their profitability, sales trends, and cost efficiency, allowing stakeholders to identify opportunities for growth and areas that need improvement.