Sales Dashboard
تفاصيل العمل


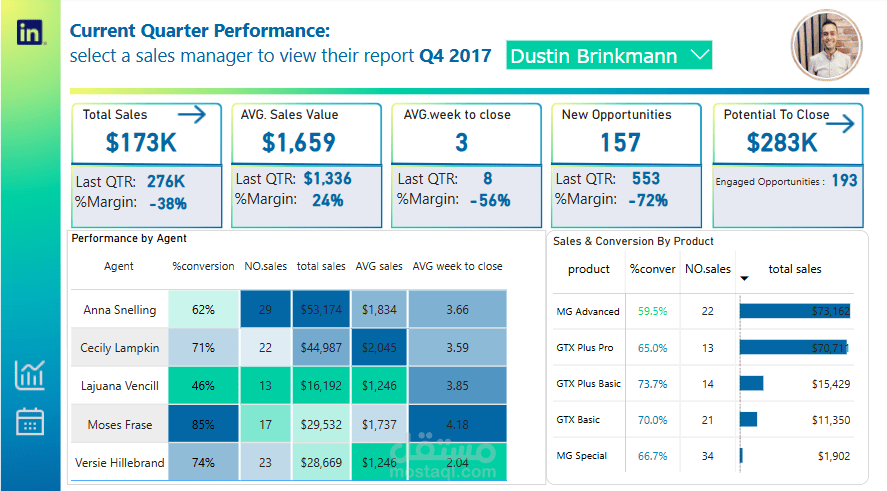
Welcome to My Dashboard!
This dashboard is designed for sales managers to track their team’s quarterly performance. To get started, select your name from the filter on the current quarter performance tab. This will populate all pages of the dashboard with your team’s information. If you’d like to view another team’s information, you can simply change the name selected in the filter and everything will update accordingly.
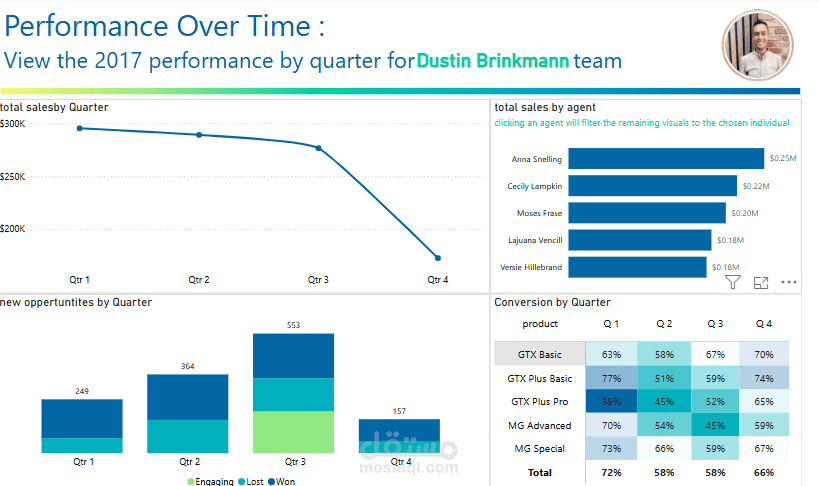
The dashboard is interactive, so more information may appear as you move your mouse across the visuals, and clicking on visuals may perform actions. For example, clicking on a visual may filter the other visuals on the page to the item you have clicked on (click a second time to de-select it), or clicking on the buttons across all pages will help you navigate the dashboard.
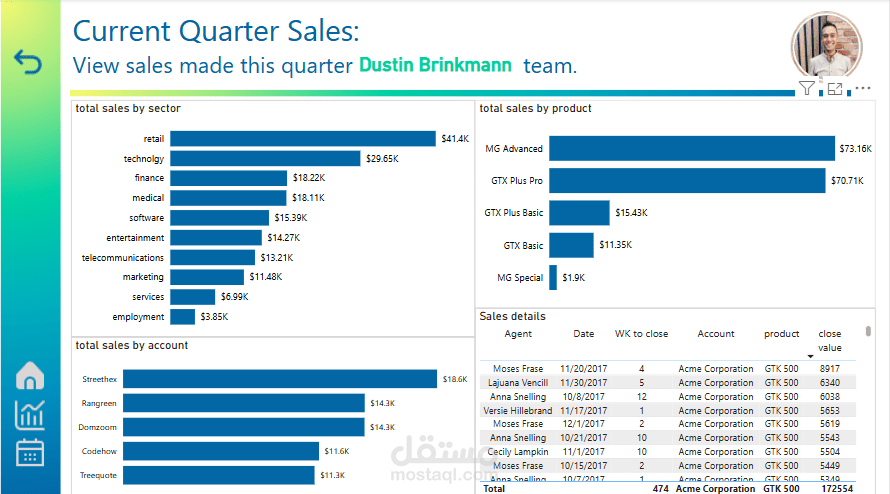
The report is filtered to the current quarter, however if you’d like to view previous quarter performance you can visit the performance over time page. You can also visit the performance by team page to see how your team is comparing across the broader business on key business metrics.
To learn how the dashboard metrics were calculated, view below, otherwise close this box to get started.
Key dashboard metric descriptions
Total Sales: the total dollar value of all sales won
No. Sales: the count of all sales won
Avg. Sale Value: the average dollar value of all sales won
Avg. Weeks to Close: the average number of weeks from engage date to close date for all closed sales
Conversion %: the percentage of sales won out of all sales won and lost. Sales that are still engaging are excluded.
New Opportunities: the number of opportunities with an engage date in the selected time period
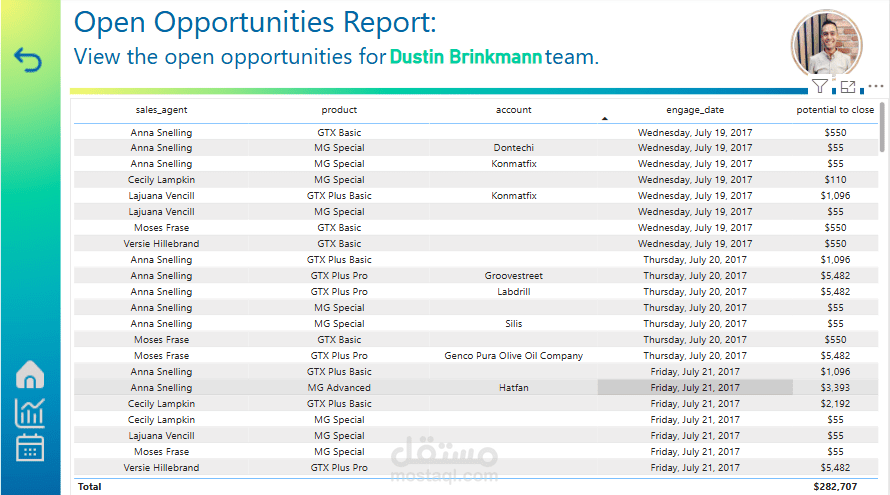
Potential to Close: the total dollar value of all sales still at engaging stage
Last QTR: the relevant metric listed above, calculated against the previous quarter
Margin : Measures the growth rate of the current quarter relative to the previous quarter.