Travel Agency Dashboard
تفاصيل العمل
1. Overview
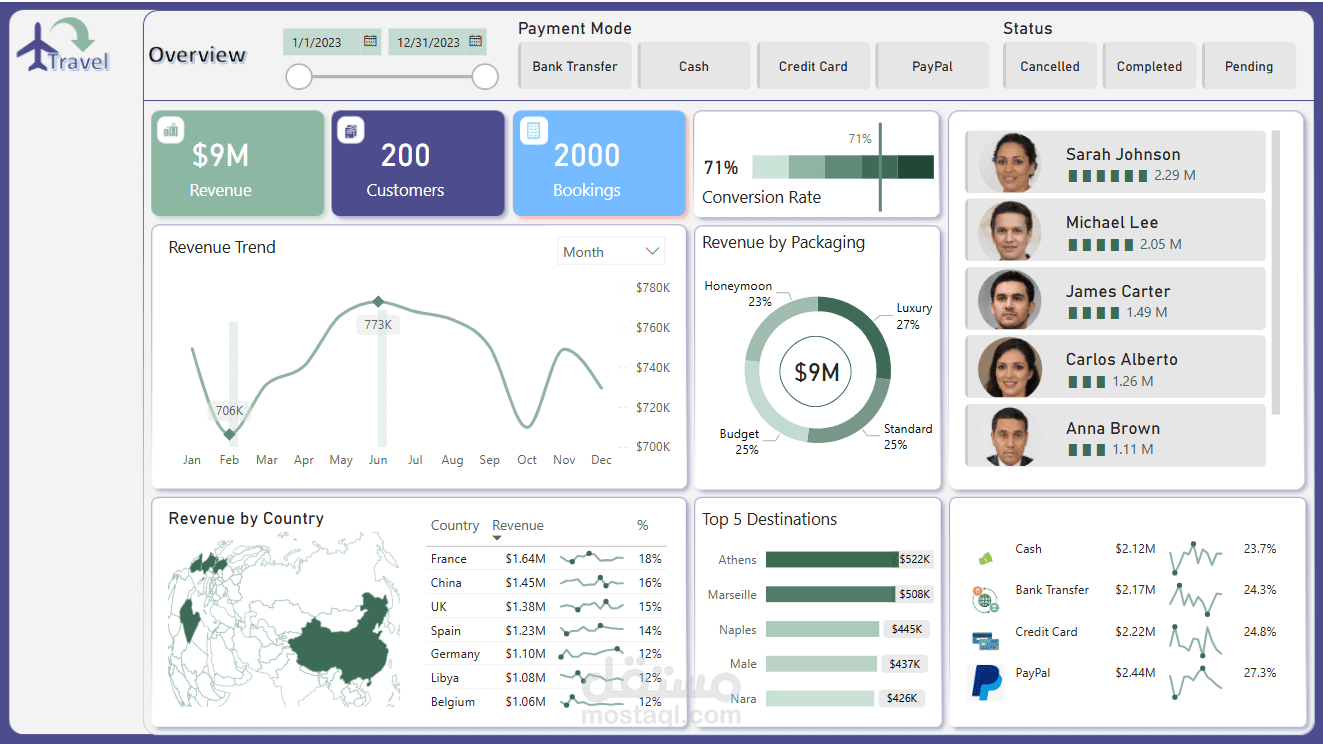
This dashboard provides insights into travel bookings, customer trends, and revenue performance. It includes key metrics such as total revenue, number of bookings, conversion rates, and popular destinations.
2. Key Metrics
Revenue: $9M total revenue from bookings.
Customers: 200 customers served.
Bookings: 2000 total bookings.
Conversion Rate: 71% of bookings completed.
Top Agent: Sarah Johnson ($2.29M revenue).
3. Filters and Interactivity
Date Range: Users can filter by booking date.
Payment Mode: Options include Bank Transfer, Cash, Credit Card, and PayPal.
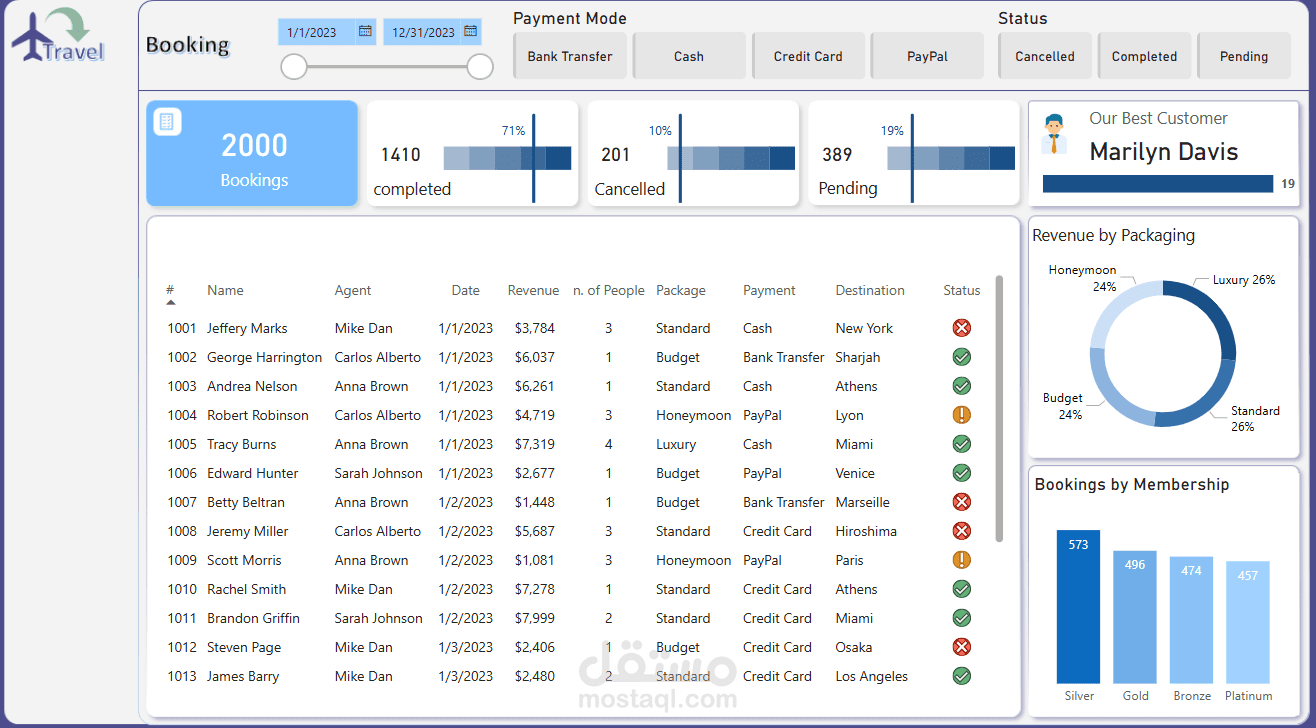
Booking Status: Filter bookings by Completed, Cancelled, or Pending.
4. Key Visualizations
Revenue Trend: Line chart showing revenue fluctuations over the months.
Revenue by Country: Map visualization displaying top revenue-generating countries.
Revenue by Packaging: Donut chart categorizing bookings into Luxury, Standard, Budget, and Honeymoon.
Top 5 Destinations: Ranked bar chart highlighting the most popular travel destinations.
5. Additional Insights
Best Customer: Marilyn Davis with 19 bookings.
Bookings by Membership: Silver membership leads with 573 bookings.
Payment Mode Distribution: PayPal accounts for the highest share (27.3%).
This dashboard enables travel agencies to monitor booking trends, identify top customers and agents, and optimize payment and packaging strategies for increased revenue.