Electronics Products Rating and Reviews Dashboard
تفاصيل العمل
⭐ Electronics Products Rating & Reviews Dashboard | لوحة تقييمات ومراجعات المنتجات
لوحة من صفحتين على Power BI تحلّل آلاف مراجعات العملاء للمنتجات الإلكترونية — لرؤية أي العلامات والمنتجات تكسب رضا العملاء وأيها يخسره في نظرة واحدة.
━━━━━━━━━━━━━━━━━━
🎯 الهدف | Purpose
Give a product team a clear read on customer sentiment across products, brands, and review sources.
📊 أهم المؤشرات | Key Metrics
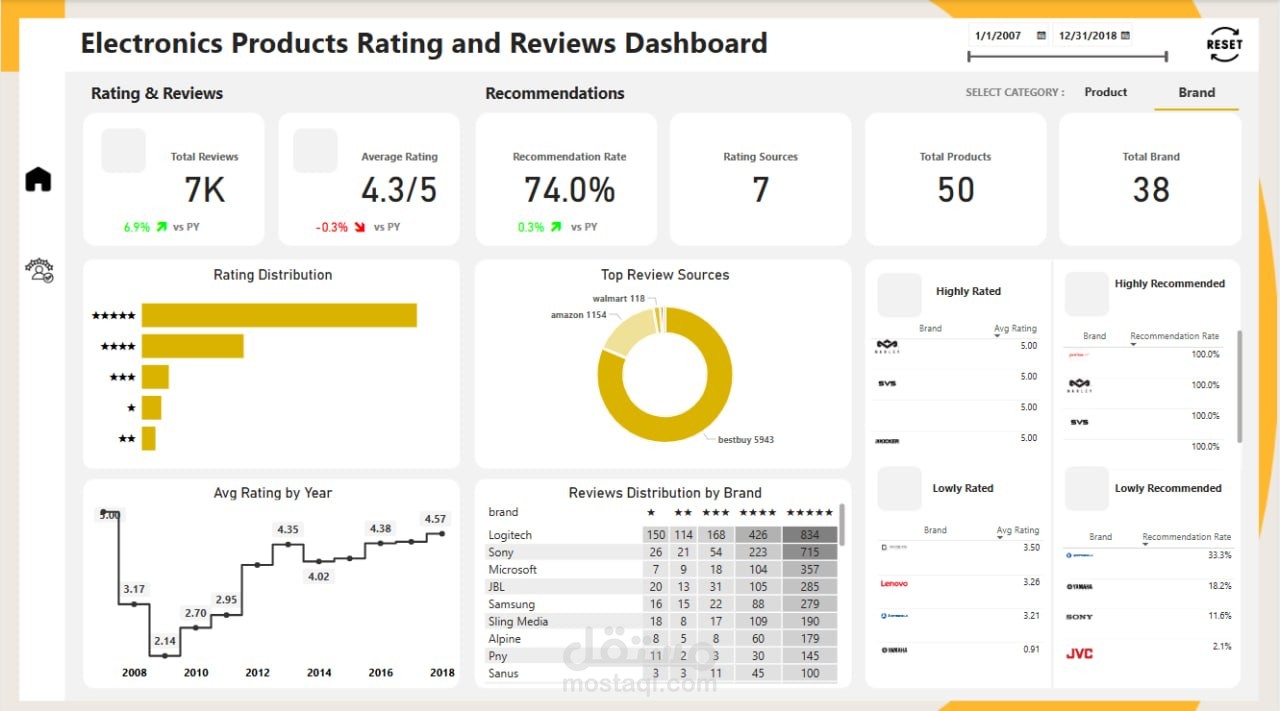
📝 Total Reviews: 7,000
📦 Products: 50 · 🏷️ Brands: 38
⭐ Average Rating: 4.3 / 5
👍 Recommendation Rate: 74%
🗂️ الصفحات | The 2 Views
1️⃣ Overview — rating distribution, top review sources (Amazon / BestBuy / Walmart), highly vs. lowly rated & recommended brands, avg rating by year
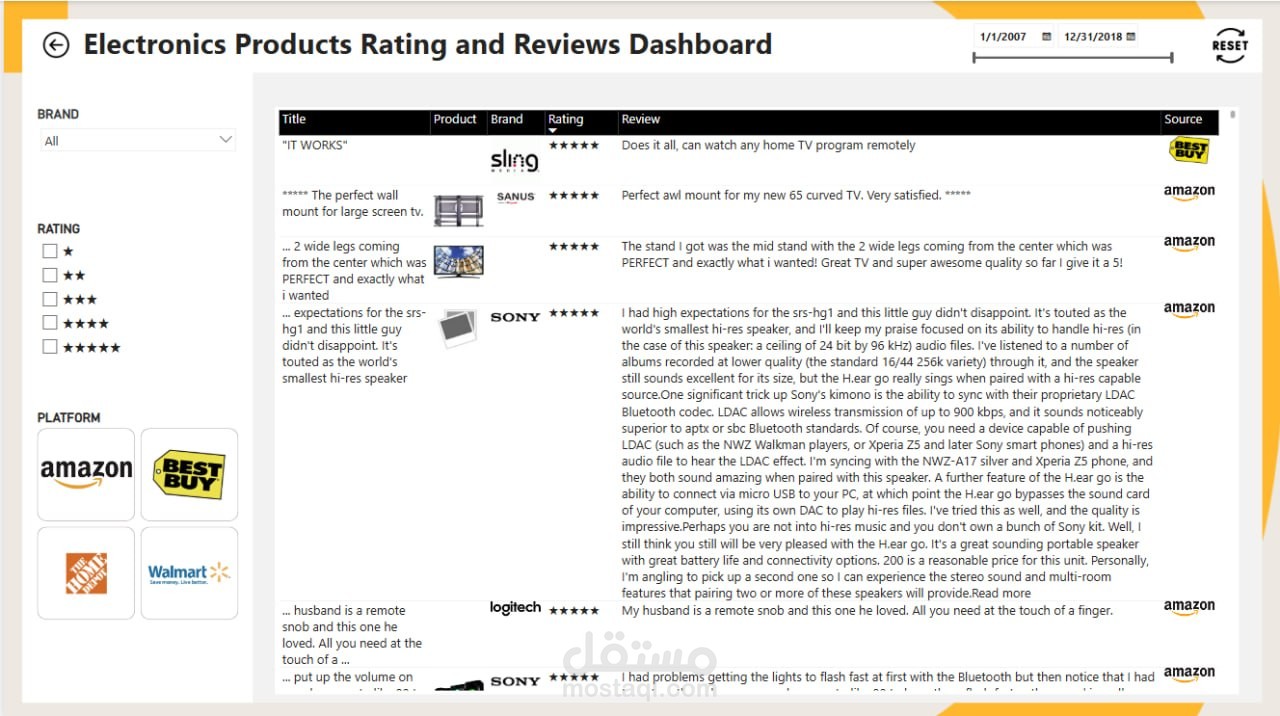
2️⃣ Review Explorer — detailed table with brand / rating / platform filters, product images & drill-through
🛠️ التفاعل | Interactivity
▫️ Slicers: brand / rating / platform
▫️ Report-page navigation
▫️ Drill-through to product level
💡 أهم الاستنتاجات | Key Takeaways
✅ 74% recommendation rate signals strong overall satisfaction
✅ Highly vs. lowly rated brands surface winners and problem brands fast
✅ Review-source view shows where customers actually leave feedback
🧰 الأدوات | Tools & Techniques
Power BI • DAX • Report navigation • Slicers/filters • Table visuals with images • Donut & bar charts • Drill-through