e-commerce dashboard (Python& Tableau)
تفاصيل العمل
I worked on the Olist dataset - a rich e-commerce dataset -. My mission? To transform this raw, unstructured data into actionable insights using Python for preparation and Tableau for visualization.
Step 1: Data Preparation in Python
- Dataset Collection and Exploration
This initial exploration revealed inconsistencies, such as null values in delivery timestamps and mismatched product categories, which required extensive cleaning.
2. Data Cleaning & Transformation
- Using Python libraries like Pandas, I tackled the following challenges:
- Datetime Standardization: Converted date columns into standard datetime formats.
- Handling Missing Data.
- Data Deduplication: Eliminated duplicate rows in datasets.
- Merging Datasets: Merged Orders and Order Items datasets to create a fact table.
- Data Export: Saved the cleaned and transformed data into Excel files.
Step 2: Data Visualization with Tableau
1. Sales Overview Dashboard:
This dashboard highlights key performance metrics, revenue trends, and geographical insights.
Total Revenue: $16.5M across the dataset timeframe, with notable growth from Q4 2016 to Q4 2018.
Regional Insights: States like São Paulo (SP) and Minas Gerais (MG) were major contributors to sales.
Category Segmentation:
The Pareto Analysis (ABC) showed that ~80% of the profit came from ~20% of the categories, with "Signaling and Security" contributing to a 50% Gross Margin %.
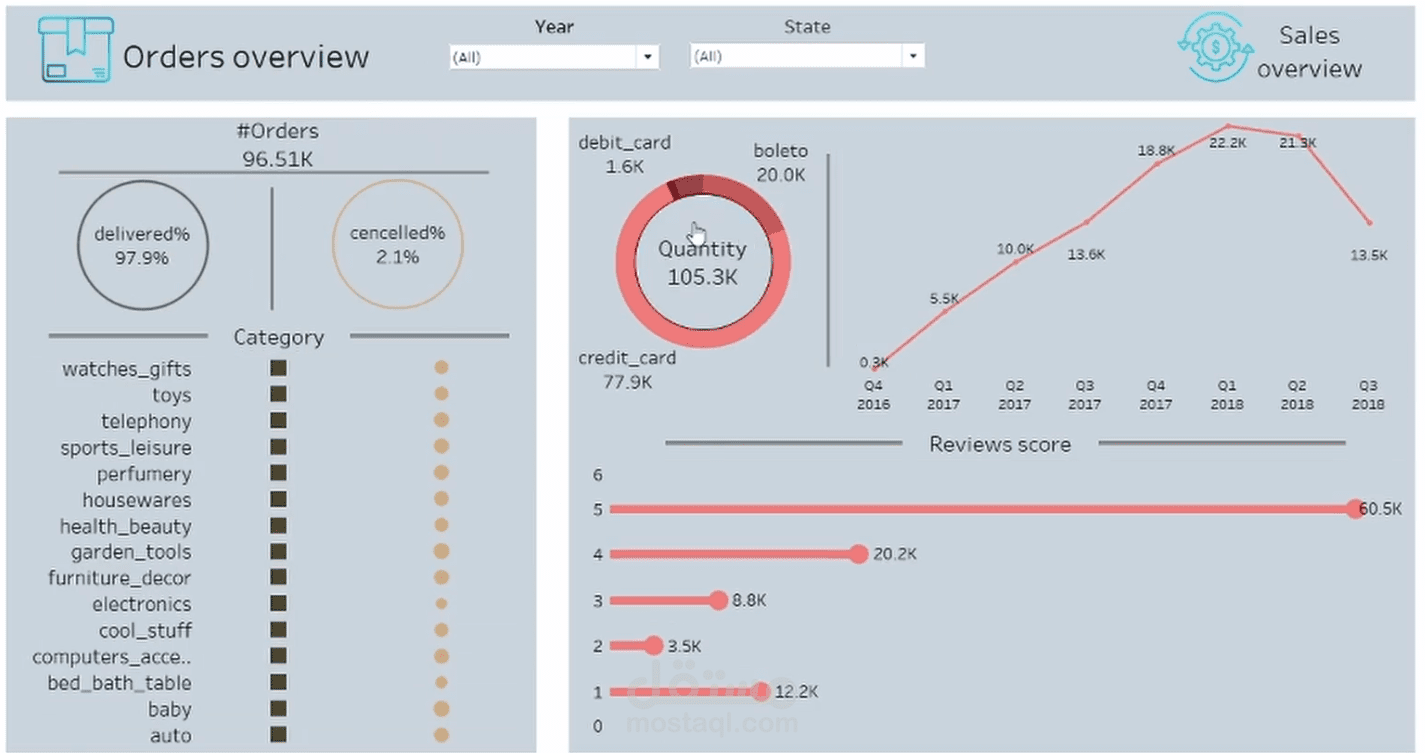
2. Orders Overview Dashboard:
This dashboard focuses on customer behavior, payment preferences, and review patterns.
Order Fulfillment:
Delivery success rate: 97.9%, showcasing a reliable logistics system.
Cancellation rate: 2.1%, indicating minimal friction.
Payment Methods: Credit cards dominated with 77.9K transactions, followed by "boleto" payments at 20K.
Customer Reviews:
A total of 105K items reviewed — with 60K 4-star and above ratings, signaling high satisfaction.