fintech dashboard (Tableau)
تفاصيل العمل

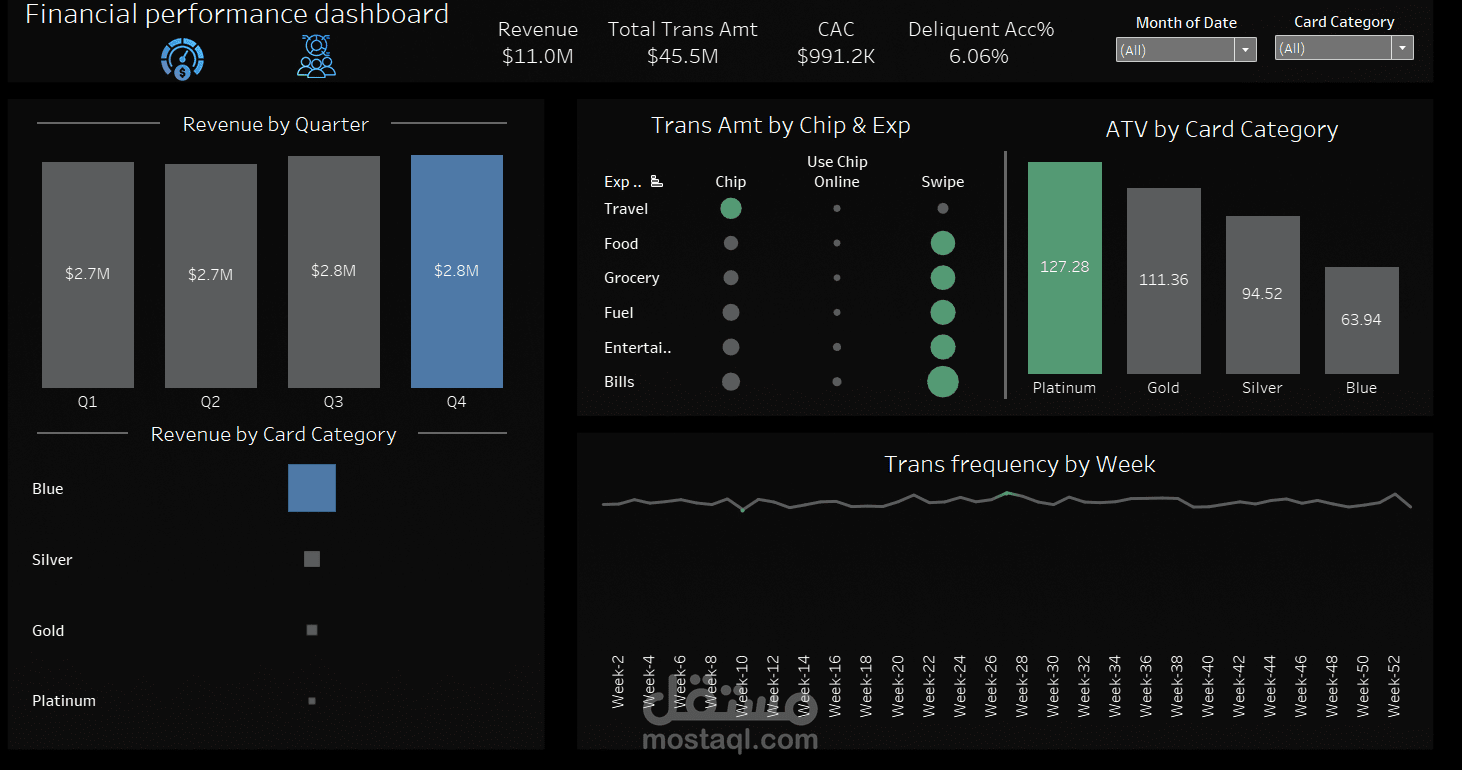
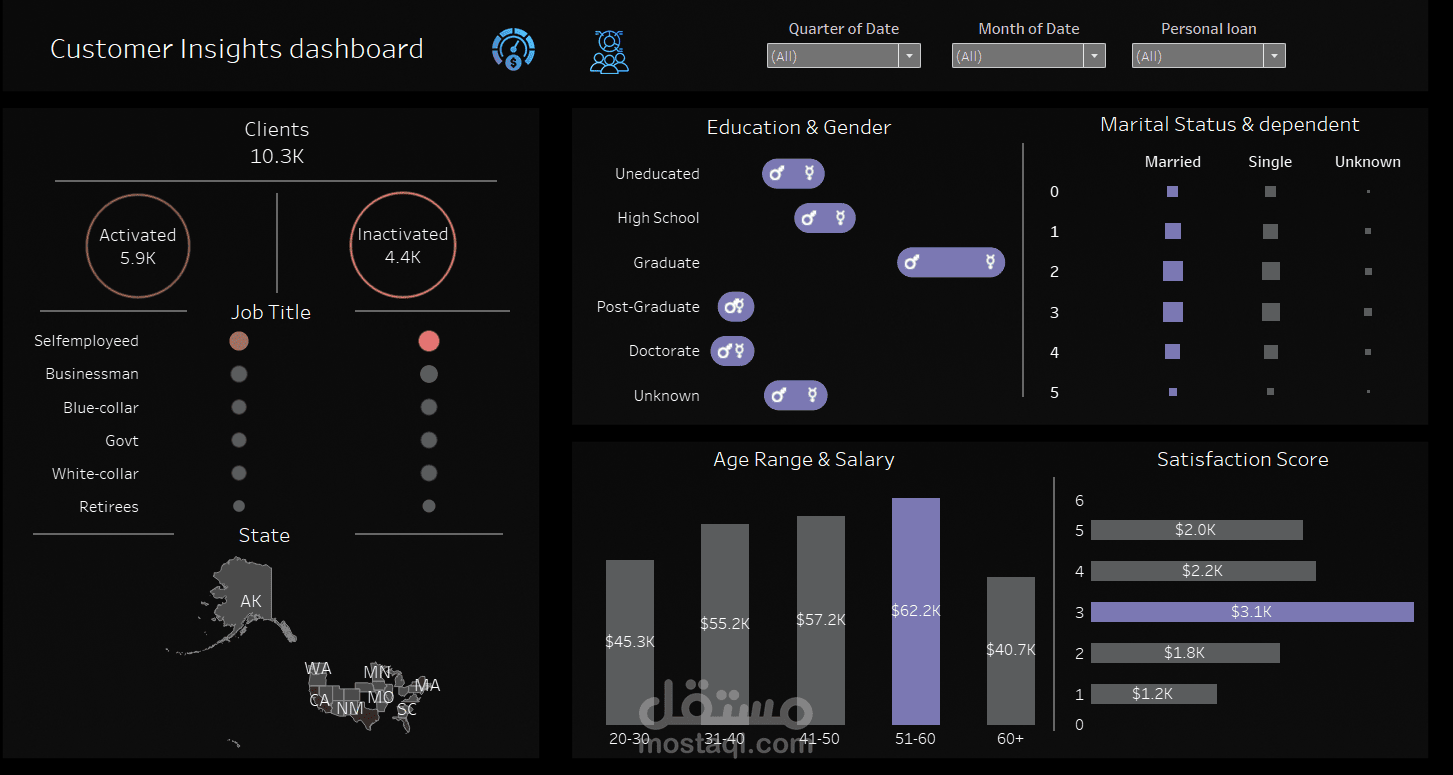
I made a Fintech project, where I harnessed the power of data analysis to uncover valuable insights that enhance our operations!
- Data Upload:
I started by uploading CSV files into Tableau.
- Data Preparation:
I checked the data types, handled null values, and unioned old data with current data to ensure accuracy.
- Building Relationships:
Next, I established relationships between the tables.
- Identifying Key Performance Indicators (KPIs):
I focused on finding essential KPIs, including:
• Revenue
• Total Transaction Amount
• Average Transaction Value (ATV)
• Transaction Frequency
• Number of Clients
• Customer Acquisition Cost (CAC)
• Delinquent Accounts%
• Total Income
- Creating a Dashboard Mockup:
I designed a simple dashboard mockup using Sketch to present these insights effectively.
- Next Steps: Data Transformation & Analysis:
I utilized calculated fields, table calculations, and filters to meet our project requirements.
- Dynamic Dashboard Integration:
I successfully combined all elements to create a dynamic, interactive dashboard that reveals crucial trends.