HR dashboard (Power BI & Power BI service & Sharepoint)
تفاصيل العمل

I made a HR project, where I used data analysis to find important information that helps improve our operations.
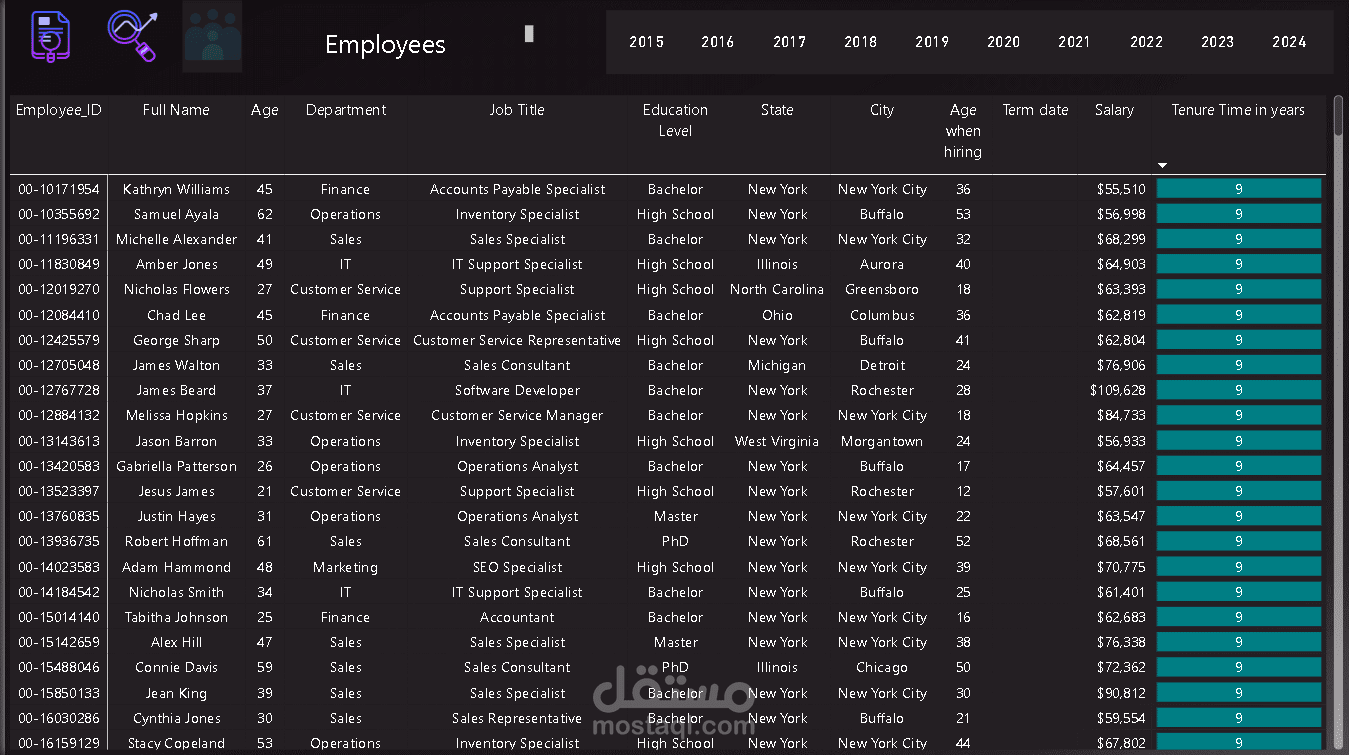
- First, I uploaded CSV file to SharePoint and accessed it using Power BI.
- Then, I started exploring the data.
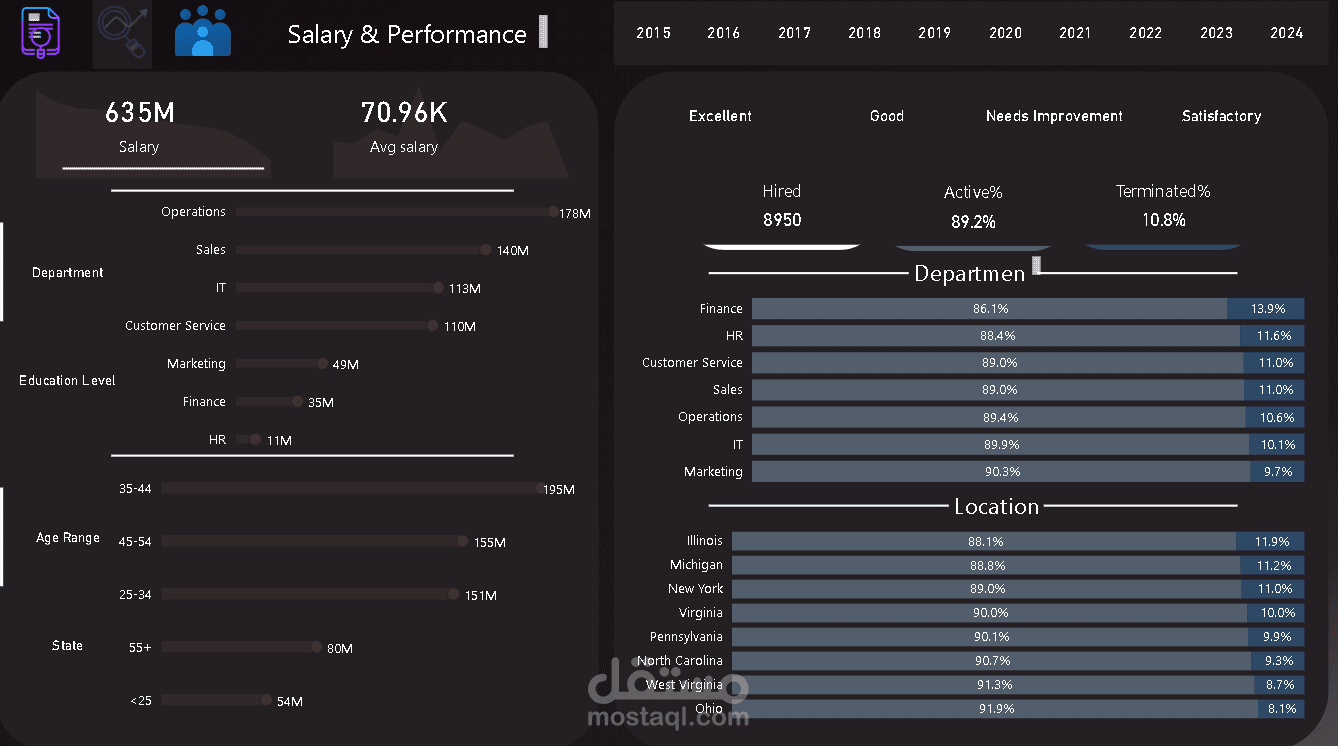
I focused on finding key performance indicators (KPIs) such as:
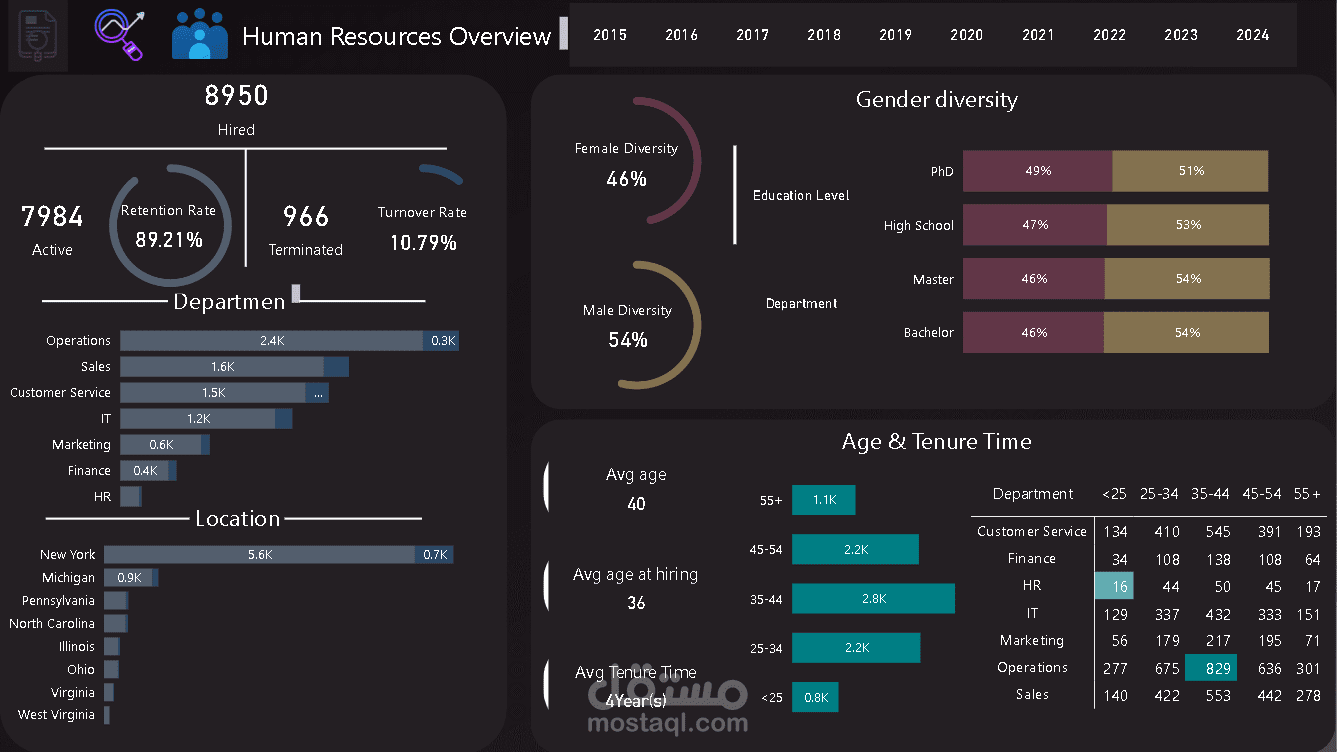
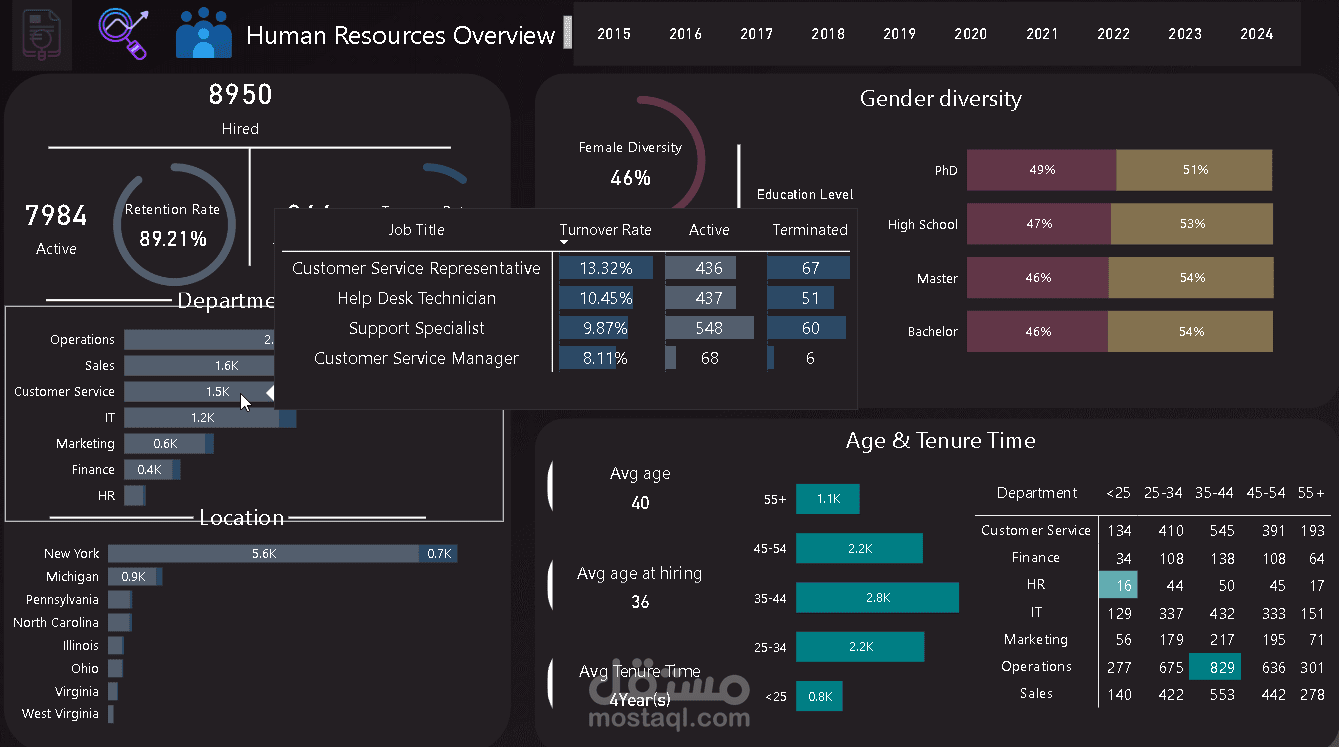
• Turnover Rate
• Retention Rate
• Number of Hired Employees
• Number of Active Employees
• Number of Terminated Employees
• Gender Diversity
• Average Age
• Average Age at Hiring
• Average Tenure Time
• Total Salaries
• Average Salary
- Creating a Dashboard Mockup:
Next, I designed a simple and attractive dashboard mockup using Sketch to show these insights.
- Next Steps: Data Transformation & Analysis:
I used Power Query to prepare and clean the data by removing duplicates, editing data types, and handling missing values. Then, I built a data model, defined relationships, and performed some DAX calculations.
- Dynamic Dashboard Integration:
I successfully combined everything to create a dynamic, interactive dashboard that reveals important trends.
- Finally, I published my dashboard to the Power BI service and ensured there is a connection between SharePoint and the dashboard for automation.