Data Analysis Task to analyse data set file for titanic
تفاصيل العمل
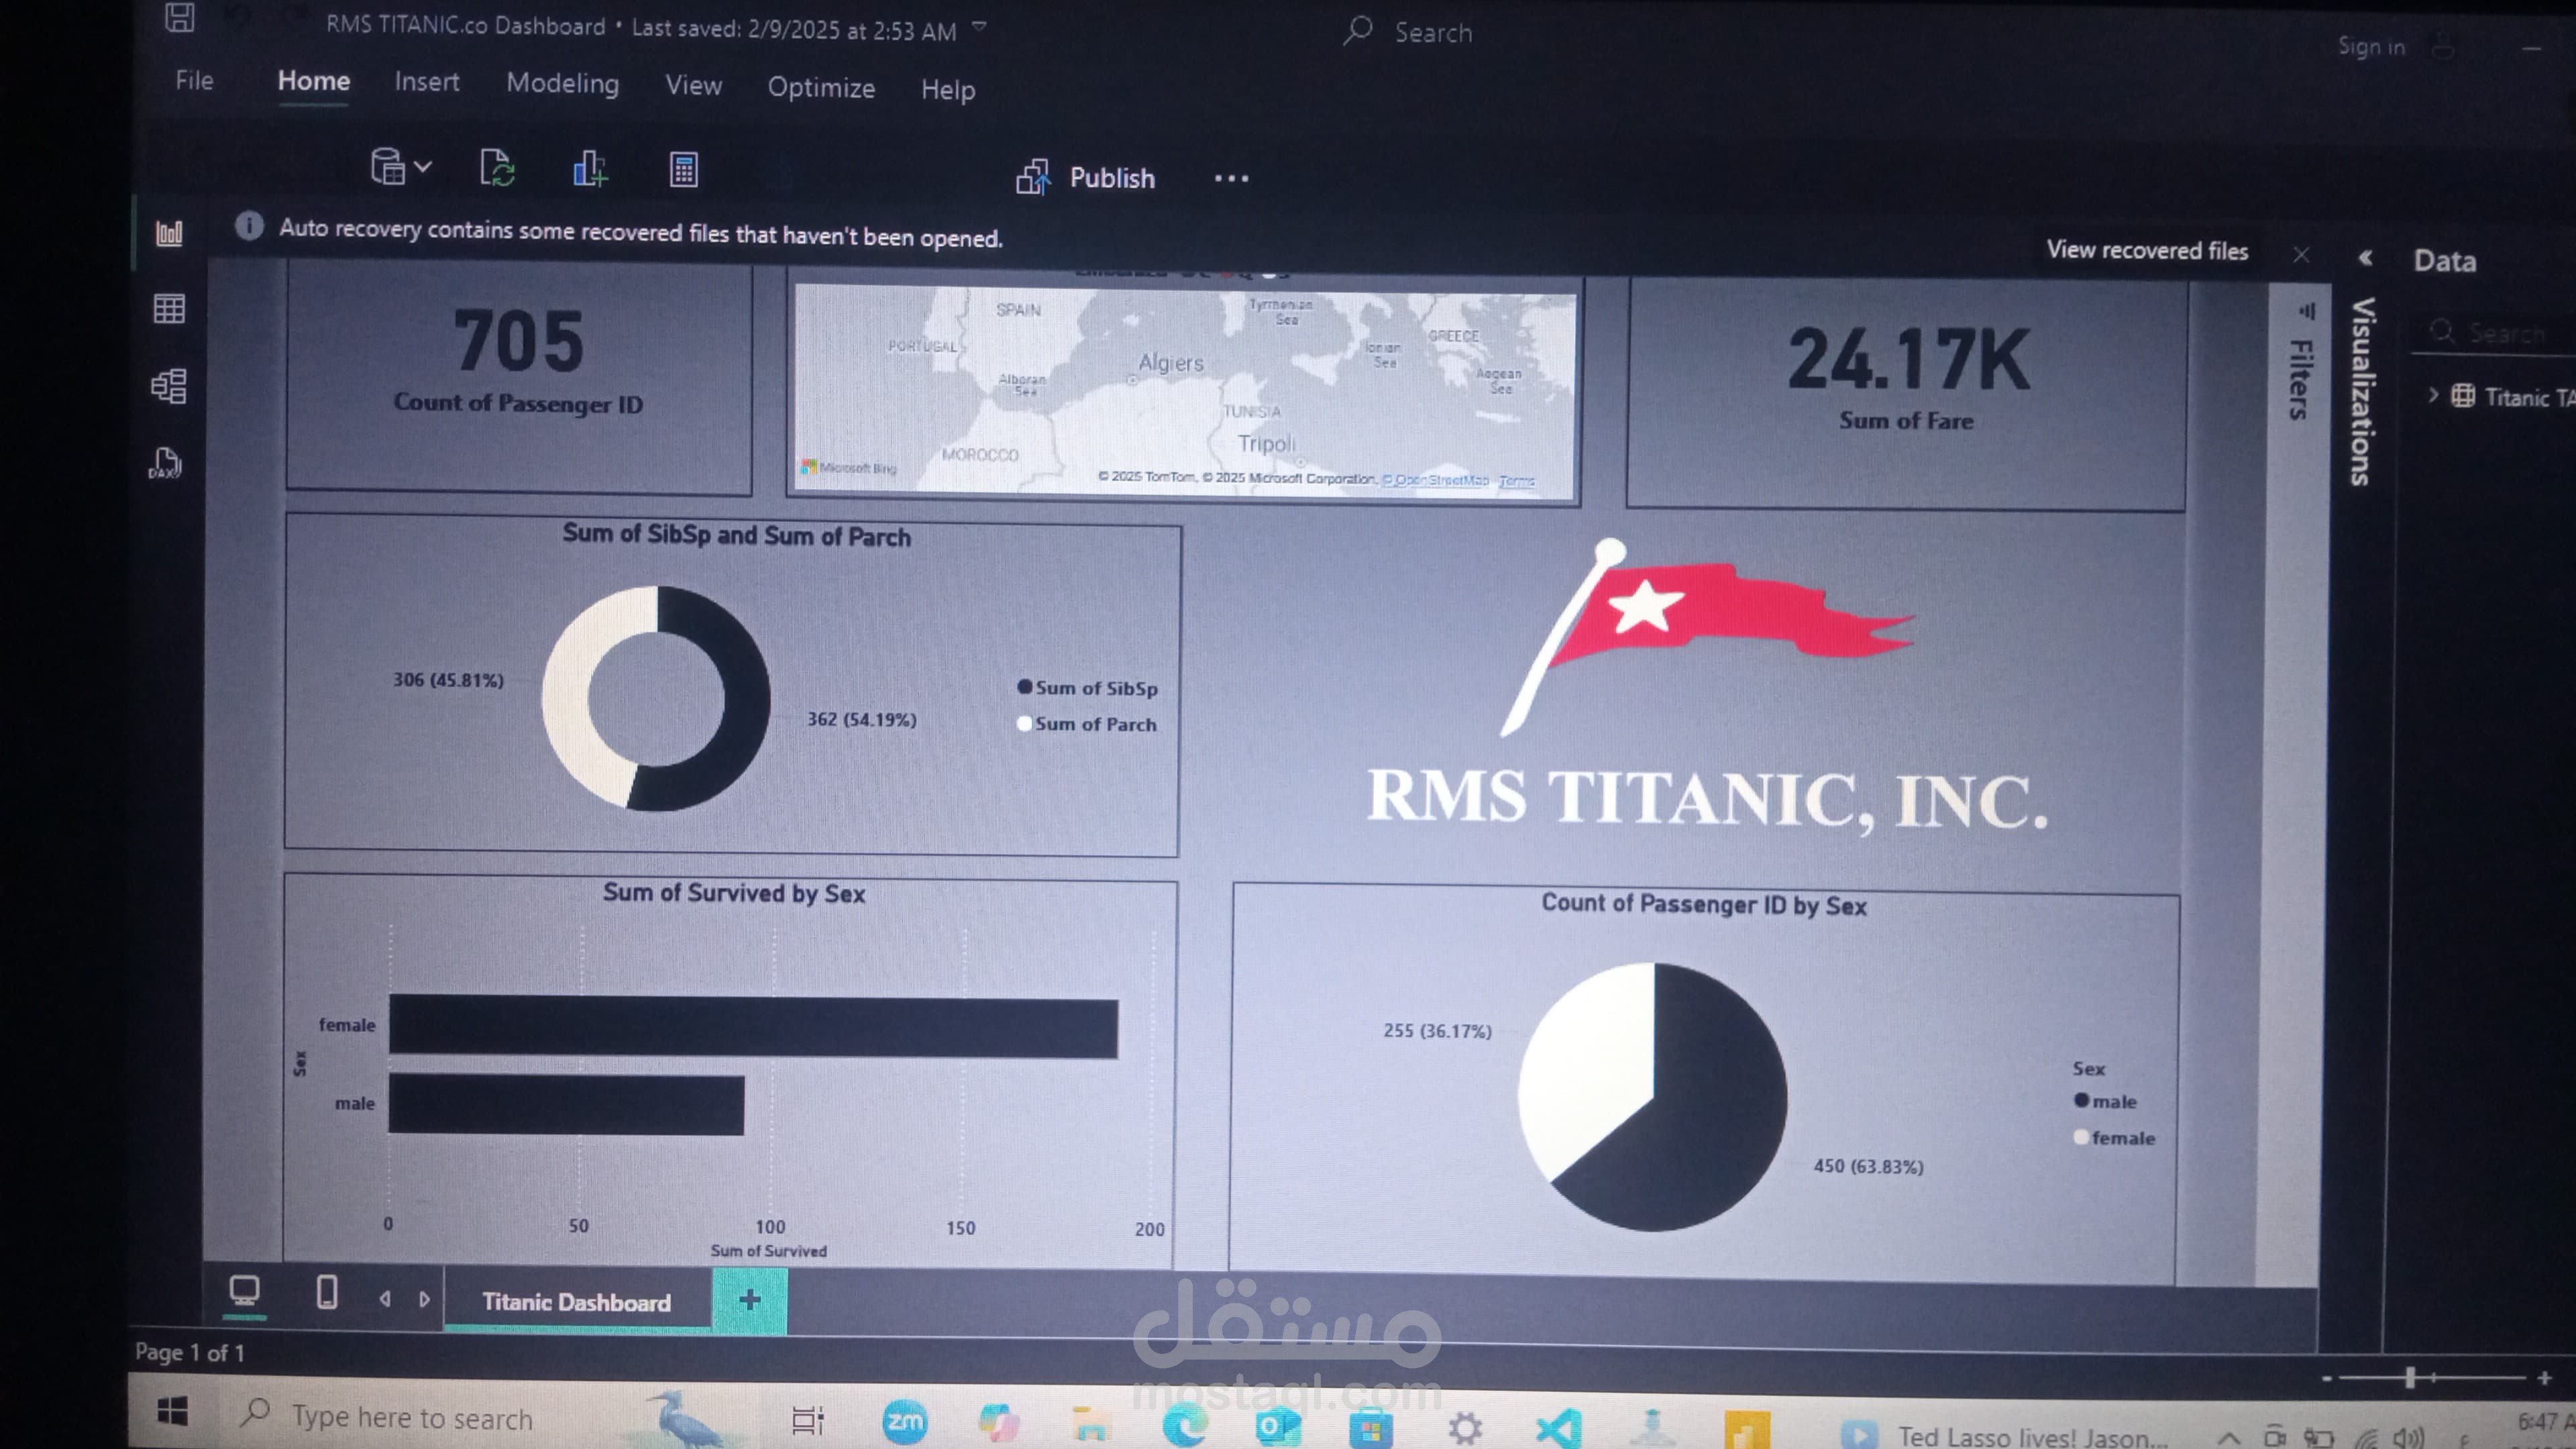

Analysis Report: RMS Titanic, Inc. Dashboard
Overview
This dashboard provides a data-driven exploration of passenger statistics aboard the RMS Titanic. The visualizations and metrics offer insights into demographics, fares, family relationships, and survival rates. It serves as a powerful example of historical data storytelling and effective dashboard design.
---
Key Insights
1. **Passenger Count**:
- The total number of passengers recorded on the dashboard is **705**, showcasing the scope of data.
2. **Total Fare**:
- The sum of all fares collected from passengers is **24.17K**, representing the economic aspect of the voyage.
3. **Family Connections Onboard**:
- **SibSp (Siblings/Spouses)** and **Parch (Parents/Children)** sums are visualized through a donut chart:
- Sum of SibSp: **362** (54.19%)
- Sum of Parch: **306** (45.81%)
- This breakdown highlights the familial relationships among passengers.
4. **Survival Analysis by Sex**:
- A bar chart shows survival numbers based on sex:
- Female survivors: Approximately **200**.
- Male survivors: Approximately **100**.
- These figures emphasize the differing survival rates between genders.
5. **Gender Distribution**:
- A pie chart depicts the count of passengers by sex:
- Male passengers: **450** (63.83%).
- Female passengers: **255** (36.17%).
- The data indicates a male-dominated demographic aboard the Titanic.
6. **Geographical Visualization**:
- A map is included to contextualize the Titanic's journey, adding a geographical dimension to the analysis.
7. **Visual Identity**:
- The dashboard features the **RMS Titanic, Inc.** logo, which enhances its branding and professional presentation.
Conclusion
This dashboard is a compelling tool that encapsulates the story of the Titanic through data. It combines effective visual design with meaningful insights, making it a valuable addition to any work gallery that showcases data visualization or historical analysis. The clarity of its visuals and the depth of the insights it provides make it a prime example of how data can bring history to life.