Walmart Sales Report Dashboard
تفاصيل العمل
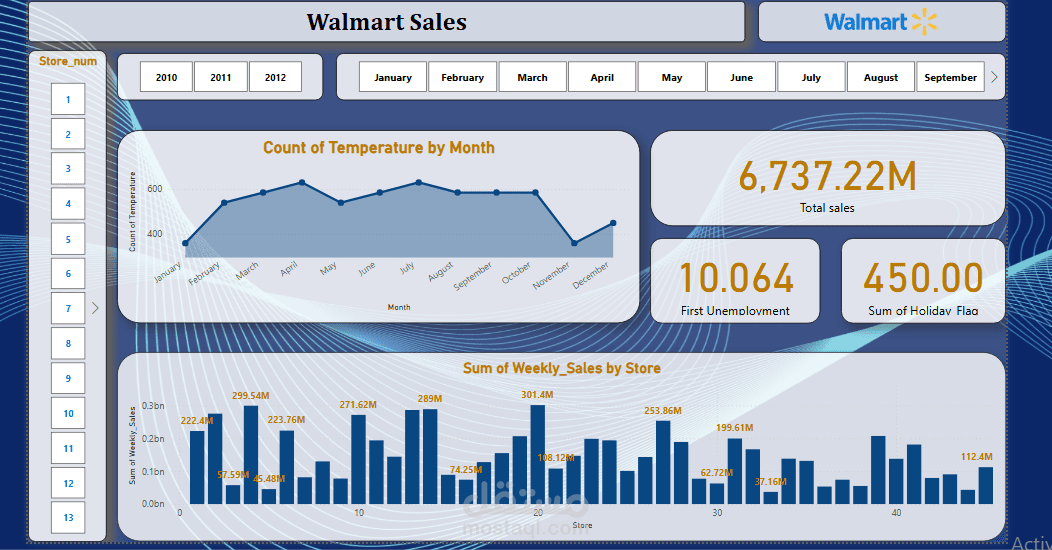
Walmart Sales Report Dashboard
Key insights include:
Monthly Trends: Analyze temperature changes by month and their impact on sales trends.
Store-Wise Performance: Compare weekly sales across 45 stores, highlighting top-performing branches such as those exceeding 300M in sales.
️ Temperature Analysis: Track monthly temperature variations and their correlation with customer purchasing behavior.
Economic Factors: Examine the effect of a 10.064% unemployment rate on sales dynamics.
Holiday Impact: Explore how 450 holiday flags influenced sales performance during the analyzed period.
Total Sales: A remarkable achievement of 6.737 billion in total sales, showcasing Walmart’s strong performance.
This dashboard transforms raw data into actionable business insights with clean and interactive visuals, demonstrating the power of Power BI in driving data-driven decision-making.