data analysis
تفاصيل العمل
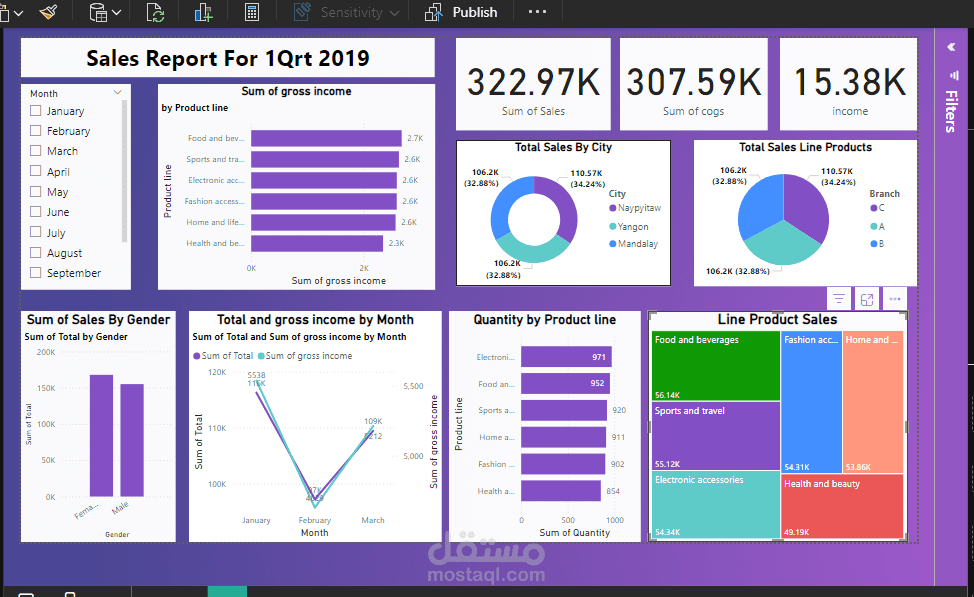
Sales Report for Q1 2019
Key insights include:
Monthly Trends: Track total sales and gross income by month for actionable insights.
️ City-Wise Performance: Visualize city contributions with clear breakdowns.
Branch-Wise Insights: Compare sales performance across branches (A, B, and C).
??? Gender Insights: Sales comparison between male and female customers.
Product Line Analysis: Explore sales, gross income, and quantity sold by product line.
This dashboard delivers actionable business insights with interactive and clean visuals. It’s another step forward in mastering Power BI and turning raw data into impactful stories!